WELCOME

Welcome and thank you for visiting!

The charts, graphs and comments in my Trading Blog represent my technical analysis and observations of a variety of world markets...
* Major World Market Indices * Futures Markets * U.S. Sectors and ETFs * Commodities * U.S. Bonds * Forex

N.B.
* The content in my articles is time-sensitive. Each one shows the date and time (New York ET) that I publish them. By the time you read them, market conditions may be quite different than that which is described in my posts, and upon which my analyses are based at that time.
* My posts are also re-published by several other websites and I have no control as to when their editors do so, or for the accuracy in their editing and reproduction of my content.
* In answer to this often-asked question, please be advised that I do not post articles from other writers on my site.
* From time to time, I will add updated market information and charts to some of my articles, so it's worth checking back here occasionally for the latest analyses.

DISCLAIMER: All the information contained within my posts are my opinions only and none of it may be construed as financial or trading advice...please read my full Disclaimer at this link.

Dots

* If the dots don't connect, gather more dots until they do...or, just follow the $$$...

Loyalty

Loyalty

ECONOMIC EVENTS

 UPCOMING (MAJOR) U.S. ECONOMIC EVENTS...

***2024***
* Fri. April 5 @ 8:30 am ET - Employment Data
* Wed. April 10 @ 2:00 pm ET - FOMC Meeting Minutes
* Wed. April 17 @ 2:00 pm ET - Beige Book Report
* Wed. May 1 @ 2:00 pm ET - FOMC Rate Announcement + Forecasts and @ 2:30 pm ET - Fed Chair Press Conference

*** CLICK HERE for link to Economic Calendars for all upcoming events.

Thursday, December 22, 2011

S&P 500 vs (nearly) Everything Else

Below is an updated Daily chartgrid, about which I wrote in my post of December 20th: http://strawberryblondesmarketsummary.blogspot.com/2011/12/markets-sample-christmas-pudding-early.html

In a nutshell, the ES (S&P 500 e-mini futures index) is high-basing after its big rally that day...a sign of distribution on lower volumes, potentially, in preparation for a push higher. There is considerable resistance overhead, however, but with the VIX trading below 25.00 now, that may be a higher probability than in recent months. Of note, however, is the fact that the U.S. $ is still trading near its highest levels since equities fell in July of this year...something to watch and see if the $ continues to rally, particularly under the scenario that I've described in my last post: http://strawberryblondesmarketsummary.blogspot.com/2011/12/currency-wars-about-to-begin.html


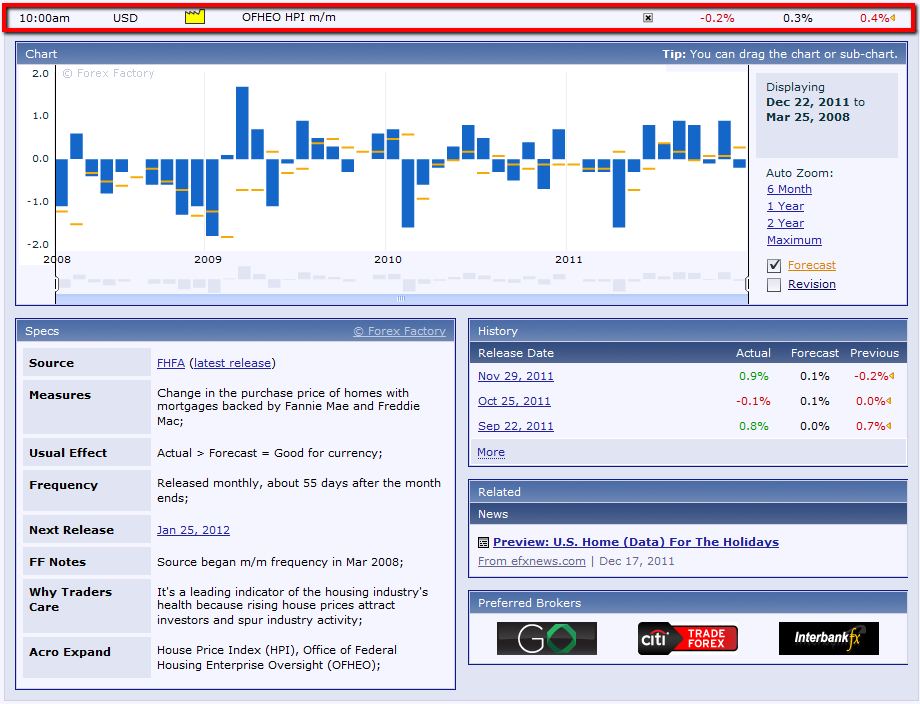
The first graph below (courtesy of www.forexfactory.com) shows a drop in the CB Leading Index...yet another indicator which shows a softening of economic conditions relating to employment, production, new orders, consumer confidence, housing, stock market prices, money supply, and interest rate spreads. The second graph shows a drop in the Home Price Index, which is a leading indicator of the housing industry's health.

Perhaps these are saying that the markets are overvalued at their current levels...time will tell.