WELCOME

Welcome and thank you for visiting!

The charts, graphs and comments in my Trading Blog represent my technical analysis and observations of a variety of world markets...
* Major World Market Indices * Futures Markets * U.S. Sectors and ETFs * Commodities * U.S. Bonds * Forex

N.B.
* The content in my articles is time-sensitive. Each one shows the date and time (New York ET) that I publish them. By the time you read them, market conditions may be quite different than that which is described in my posts, and upon which my analyses are based at that time.
* My posts are also re-published by several other websites and I have no control as to when their editors do so, or for the accuracy in their editing and reproduction of my content.
* In answer to this often-asked question, please be advised that I do not post articles from other writers on my site.
* From time to time, I will add updated market information and charts to some of my articles, so it's worth checking back here occasionally for the latest analyses.

DISCLAIMER: All the information contained within my posts are my opinions only and none of it may be construed as financial or trading advice...please read my full Disclaimer at this link.

Dots

* If the dots don't connect, gather more dots until they do...or, just follow the $$$...

Convertible at Beach

Convertible at Beach

ECONOMIC EVENTS

UPCOMING (MAJOR) U.S. ECONOMIC EVENTS...

***2026***
* Wed. Sept. 16 @ 2:00 pm ET - FOMC Rate Announcement and @ 2:30 pm ET - Fed Chair Press Conference

*** CLICK HERE for link to Economic Calendars for all upcoming events.

Showing posts with label Technology. Show all posts

Friday, January 24, 2025

SPX: What's In Store From 2025 To 2029?

On December 29, 2019, I posted this article on the SPX which analyzed its history from 1932, and which presented a long-view forecast of what's in store for the 2020s and 2030s.

Overall, it showed that, for the most part, the SPX has been a strong BUY candidate for longer-term investors over an average of 30 years running, and that it was likely to be repeated for another 10-20 years, generally speaking, based on the following chart (each candle represents a period of one year).

SPX Yearly chart

As can be seen on the following current monthly chart, price dropped a bit from that date before it began to rise, break above the long-term channel and rise again, then drop and retest the breakout level, before, finally, proceeding to form a new and steeper channel and upward trend (defined by an Andrew's Pitchfork technical drawing).

In keeping with the above-referenced bullish outlook for the 2020s, I'd expect to see the SPX trading around one of two possible levels by the end of President Trump's second term (January 20, 2029)...barring any catastrophic events, of course:

  • 9,500 at the upper edge of the lower 1/4 of the channel, or
  • 11,000 at the upper edge of entire channel
So, we'll see what happens...and, as I explained in the above-referenced post, as long as the Technology Sector remains strong until then, one of those two scenarios is a very real possibility.

SPX Monthly chart


Wednesday, June 15, 2022

BITCOIN: The "Emperor-Wears-No-Clothes" Klepto-Currency Crapshoot Has Finally Been Exposed

* See UPDATE below...

I've been calling for 20,000 on BITCOIN (BTC/USD) since my post of May 20, 2021. It hit a low of 20,089, so far, today.

The BEARS are still firmly in control.

Major support lies much lower at 10,000...an inviting downside target...followed by ZERO.

* UPDATED June 19...

Investing.com is also expecting BITCOIN to "plummet below 10,000," as noted in today's article.

It hit a low of 17,611 yesterday.

* UPDATE July 20...

Another "klepto-currency" aptly self-described "lunatic" bites the dust...one of many, so far...with, possibly more to come...

"Save me from myself!" seems to be the humiliating intimation from this guy...😏

Remember the old adage...Buyer beware!

ZeroHedge excerpt

* UPDATE July 23...

More klepto-currency wealth destruction hits retail chumps investors...

* UPDATE July 25...

More troubles ahead for cryptos...

Meanwhile COIN's fall from grace has been spectacular...in just a little over one year from its IPO...


Cathie Who?

It's a mystery why anyone would take seriously what Ark Invest CEO/CIO Cathie Wood has been, and still is, forecasting for markets, as she's been wrong for months, while her own ARK Innovation ETF (ARKK) has lost 76.25% of its value from its high of 159.70 in February 2021 to close at 36.99 on Tuesday, as shown on the following monthly chart and graphs. The bears are still firmly in control of this ETF.

We'll see if it hits its IPO price of 20.42, or lower. If it holds below 40.00, we may see that level reached...possibly sooner rather than later.


StockCharts.com

StockCharts.com


Tuesday, February 08, 2022

Facebook Fizzles

Facebook (FB) has had half a Trillion dollars scalped from its value recently, as noted in the following article.

CEO Mark Zuckberg, himself, has been a seller, not a buyer, for several years, as shown here.

FB is approaching its 'Chaos Zone,' which begins around the 200 level, as shown on the following monthly chart.

A drop and hold below that level could send it plunging to 120, or lower in short order.

Or, we may see it whipsaw within that zone for some time before this stock and its social media platform, either recover, or fizzle into obsolescence.

At the moment, the sellers are firmly in control on this timeframe...favouring the fizzle scenario.


Monday, February 07, 2022

Alibaba Ensconced In Chaos Zone

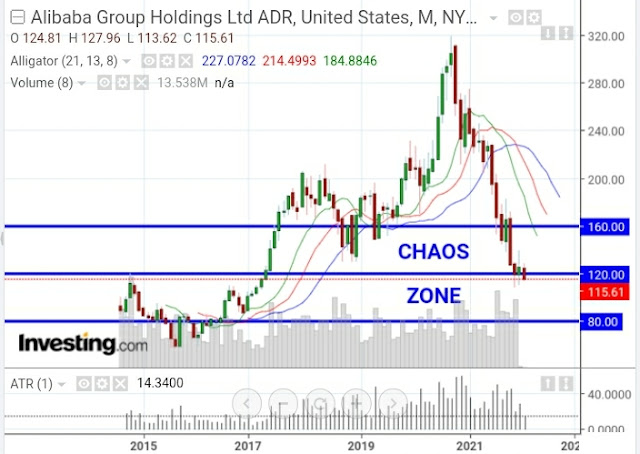
Alibaba (BABA) has plunged into what I call a 'Chaos Zone,' as shown on the following monthly chart.

As you can see, it's nearing its IPO price of 92.70 in September 2014, after reaching a high of 319.32 in October 2020.
The following article mentions a scenario that may occur.

Before we see that happen, if at all, we may see BABA drop somewhat further on this rumour, then reverse sharply and possibly retest the 160.00 level, or thereabouts. I'd look for a large volume spike, together with an extreme ATR print (based on a value of one period, as shown), to confirm such a V-bottom reversal had occurred at a lower price level.

It may be that, during such a reversal to the upside, SoftBank begins to dump its shares, in which case, we'd likely see volatile price moves in both directions...possibly within the upper half of the 'Chaos Zone,' or around the 120.00 level. Price may spin around 120.00 ('thread the needle') before it moves erratically higher toward 160.00.

Failure of BABA to move and hold above 160.00, on increasing volumes, may signal much further weakness ahead, with price, ultimately, retesting 80.00, or lower.

So, there is a lot of room for wild price swings to occur within BABA's 'Chaos Zone,' along with the release of wild rumours about SoftBank, or something/someone else.

Buyer beware!

P.S. SoftBank's own stock (SFTBY) has dropped considerably from its 2021 high of 50.00 and is mired in its own 'Chaos Zone,' as shown on the following daily chart.

It's in solid downtrend and is still under the bearish influences of a moving average Death Cross that formed in mid-2021.

A drop and hold below 20.00 could force a retest at 17.5, or lower at 15.00

A drop and hold below 15.00 could prompt its sale of some or most/all of its stake in BABA, as described above...or, even as soon as a break and hold below 20.00 on increasing volumes.

The monthly chart of SFTBY shows a macro view of price action, the 'Chaos Zone,' and other major support and resistance levels.

Watch for any extreme spikes in the volume and the ATR indicator (shown with an input value of one period) to, potentially, verify a trend reversal after any further plunge lower in price on this timeframe...particularly if it breaks and holds below 20.00 with force.

The following daily ratio chart of SFTBY:BABA shows that there has been a whipsaw struggle for relative strength between the two since mid-2018.

This ratio has been trading in its own 'Chaos Zone' since the beginning of 2021.

A rapid plunge on this ratio could spell big trouble for both stocks. A drop and hold below 0.150 could be catastrophic for both, so keep an eye on this.

In any event, they're both weak and mired in their own 'Chaos Zones.'

Expect volatile churn to continue until we see clear breakouts or breakdowns and holds, with conviction...on BABA, SFTBY, and SFTBY:BABA.


Wednesday, February 02, 2022

NDX:VXN Ratio At A Critical Level

I last wrote about the NDX:VXN ratio in my post of January 22

As of 1:42 pm ET today, it is trading in between two important price levels, namely, 500 and 550, as shown on the following daily ratio chart.

The RSI is sitting just below the 50 level, the MACD has formed a bullish crossover, and the PMO is preparing to cross over to the upside.

However, a recent bearish moving average Death Cross formation awaits above, as mentioned in my post above.

Failure of this ratio to break and hold above 550, then break and hold above the 200-day moving average (currently around 668), will signal more weakness, indecision, and volatile swings ahead for the Nasdaq 100 Index (NDX).

A drop and hold below 500 will signal extreme weakness in the NDX and the Technology Sector.

The FNGU ETN, mentioned in my post above, managed to hold above 20.00, then break back above 25.00, as shown on the following monthly chart. 

Price action in between major resistance at 30.00 and major support at 25.00 is very thin, and there's not much to stop it from retesting the 20.00 level, or plunging even lower.

The February candle is being supported, thus far, by weak Buyers, as depicted on the Balance of Power indicator below.

So, watch for a drop and hold below 500, then 400 for the NDX:VXN ratio and a drop and hold below 25.00, then 20.00 for FNGU as a sign that extreme weakness is in store for the Nasdaq 100 Index and the Technology Sector.

Otherwise, look for further volatility and extreme swings in both directions in the NDX, the Technology Sector, the NDX:VXN ratio, and the FNGU ETN for the foreseeable future.

P.S. By the way, apparently TWTR has been replaced by MSFT in the FNGU ETN basket of stocks. The following revised one-year daily chartgrid of FNGU and its 10 stocks incorporates this update.


Sunday, January 23, 2022

ARKK: Bears Still In Control

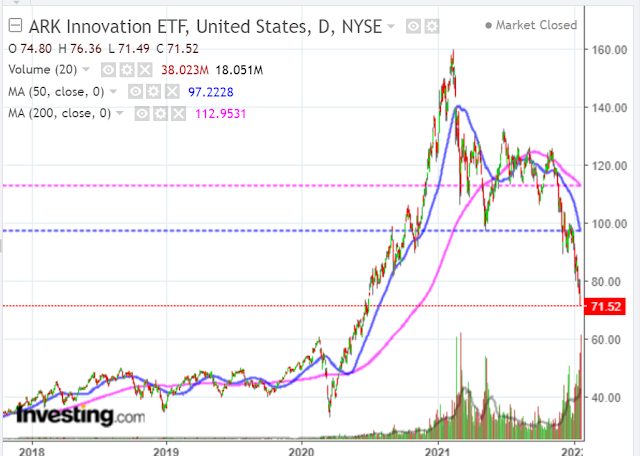
An inverted cup and handle began to form in November of 2020 on ARK Innovation ETF (ARKK), as shown on the following daily chart.

A bearish moving average Death Cross formed on June 30, 2021 and never reversed after that date.

The bears are still firmly in control of this ETF.

As of last Friday, price is sitting just above the 50-month MA (70.696) and just below the 200-week MA (73.404).

A break and hold below 70.00 could send it down to 40.00, or lower to its IPO price around 20.00.


Saturday, July 18, 2020

China's Predatory Tactics Against US Companies

U.S. Attorney General Bill Barr spoke on July 16 at the Gerald R. Ford Presidential Museum and blasted China's predatory tactics against US companies. Tech companies and Hollywood did not escape criticism.

transcript of the AG's prepared remarks can be read at this link.


China's Shanghai Index (SSEC) dropped below 3300 last week after briefly piercing it, as shown on the following weekly chart.

The sellers have regained control of the Balance of Power on this timeframe.

If the SSEC fails to reclaim and hold above 3300, and if buyers fail to return convincingly, it could drop to around 2800, or so, inasmuch as 3300 seems to be the Bull/Bear line-in-the sand at the moment.