WELCOME

Welcome and thank you for visiting!

The charts, graphs and comments in my Trading Blog represent my technical analysis and observations of a variety of world markets...
* Major World Market Indices * Futures Markets * U.S. Sectors and ETFs * Commodities * U.S. Bonds * Forex

N.B.
* The content in my articles is time-sensitive. Each one shows the date and time (New York ET) that I publish them. By the time you read them, market conditions may be quite different than that which is described in my posts, and upon which my analyses are based at that time.
* My posts are also re-published by several other websites and I have no control as to when their editors do so, or for the accuracy in their editing and reproduction of my content.
* In answer to this often-asked question, please be advised that I do not post articles from other writers on my site.
* From time to time, I will add updated market information and charts to some of my articles, so it's worth checking back here occasionally for the latest analyses.

DISCLAIMER: All the information contained within my posts are my opinions only and none of it may be construed as financial or trading advice...please read my full Disclaimer at this link.

Dots

* If the dots don't connect, gather more dots until they do...or, just follow the $$$...

Loyalty

Loyalty

ECONOMIC EVENTS

 UPCOMING (MAJOR) U.S. ECONOMIC EVENTS...

***2024***
* Wed. March 6 @ 2:00 pm ET - Beige Book Report
* Fri. March 8 @ 8:30 am ET - Employment Data
* Wed. March 20 @ 2:00 pm ET - FOMC Rate Announcement + Forecasts and @ 2:30 pm ET - Fed Chair Press Conference
* Wed. April 10 @ 2:00 pm ET - FOMC Meeting Minutes

*** CLICK HERE for link to Economic Calendars for all upcoming events.

Monday, January 31, 2022

SPX Pivot Points For February 2022

The following pivot point calculations and chart are provided to illustrate a variety of support and resistance levels/price targets on the monthly timeframe for the S&P 500 Index (SPX).

The calculations below are based on the high/low/close of January's candle for February's pivot point levels/price targets.

The following monthly chart shows that January's candle closed just below the Pivot Point for February (noted above at 4518.3233) [depicted as the horizontal blue moving average...1-month MA (h/l/c/)].

Similarly, the February R1 and S1 pivot point levels/price targets are very near January's high and low.

So, we may see either, or both, of those levels re-tested before a new monthly trend is created and, subsequently, confirmed in the coming months.

At the moment, the Balance of Power has flipped from buyers to sellers on this timeframe. Keep an eye on this indicator for clues on future monthly price action, market sentiment and trend confirmation.


Bad Economic News For American Consumers

* See UPDATE below...

A variety of economic reports were released last Friday.

They're confirming rising prices of consumer goods and services, lower wages, falling consumer spending, falling consumer sentiment, and higher consumer inflation expectations, as shown on the following graphs (source: ForexFactory.com)...bad news for consumers and at variance with Wall Street's expectations for higher equity prices and higher company earnings for 2022.


I'll repeat what I said in: 


* UPDATE February 3...

Stagflation and the threat of war are on the horizon...not a good combination for world markets...


Fed 'No-Speak' 🤔


Friday, January 28, 2022

From This Week's "Smile File"...Are They Vaccinated? 😊


COIN: From Riches To Rags

QUESTION: Why would anyone invest in a broker's stock that is trading well below its IPO price?

"Coinbase Global Inc., branded Coinbase, is an American company that operates a cryptocurrency exchange platform. It operates remote-first, and lacks an official physical headquarters." Wikepedia

Coinbase (COIN) went public on the Nasdaq exchange on April 14, 2021. It opened at 381.00, reached a high of 429.54, a low of 310.00, and closed at 328.28 that day.

Since then, price has fluctuated wildly, but never retested its opening-day high, as shown on the following weekly chart, and has plunged to and closed at a new low on Thursday at 170.20.

There have been almost twice as many sellers as buyers of this stock during this time, and it has lost about 60% of its value from its IPO high.

ANSWER: So, with regard to my question above, it's a mystery to me...as is the hype around buying Bitcoin (BTC/USD), about which I've written numerous articles here.

TO WRAP IT UP: The monthly chart looks even more nasty...and amplifies the ponzi-like risk associated with trading cryptocurrencies...in my opinion.

P.S. But, the plunge didn't stop here...there's even more carnage that followed, as described here...


Wednesday, January 26, 2022

Indecision Grips The SPX Amid A Rising Misery Index

I last wrote about the SPX and the Federal Reserve here.

The high-wave candle forming on the following weekly chart of the SPX indicates indecision by investors.

It's formation, thus far this week, follows today's FOMC interest rate statement and Chairman Powell's press conference...about which I wrote in today's UPDATE in my above-mentioned article.

As of Wednesday's close on this weekly candle, the Balance of Power is slightly in favour of the buyers.

However, with very little price movement to the downside, that balance can shift in an instant.

It's one indicator worth watching, especially into Friday's close this week, and beyond.


With the Misery Index on the rise under President Biden's radical socialist policies, executive actions, and agenda, we're likely to see high volatility continue in both directions in all markets for the foreseeable future and into 2023, and beyond.

The Misery Index is currently at 10.94.

My post entitled SPX: The Blowoff Phase Has Begun describes the factors affecting these moves and provides links to a variety of my articles for further insights, as well as price targets and support/resistance levels for the SPX...all worth a read.


Tuesday, January 25, 2022

Is Bitcoin Really A Hedge Against Inflation?

Short answer...NO...in spite of what those flogging its purchase over the last couple of years have been, and still are, proclaiming (and with a straight face, too).

Take a look at the following weekly chart of Bitcoin and compare its price moves (peaks and valleys) with that of the 20-year 12-month Percentage Change, CPI graphic below (measuring inflation of goods and services).

While CPI has continued to rise since January of 2021 and hit a 12-month percentage increase of 7% in December 2021 (a 20-year high), Bitcoin has lost almost all of its gains made (twice) from January 2021, onward.

So...NO...Bitcoin is not a reliable hedge against inflation...case closed. 

These graphics proved my point.

I've written numerous articles about Bitcoin over the last several years and you can find them at this link.


Repeat...Repeat...Repeat...

~~~~~~~~~

"If you walk on snow 
you cannot hide your footprints."
-- Anonymous

~~~~~~~~~


Monday, January 24, 2022

Volatility Bites U.S. Markets...But, Should It Bite The Fed?

* See UPDATES below...

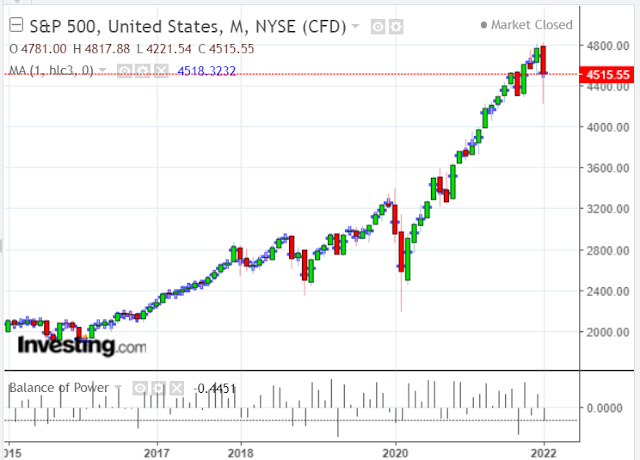
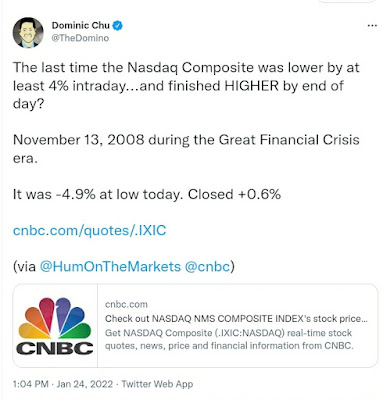
The SPX had a wild ride today, with an intraday trading range of 194.7 points, complete with a gap down on the open, followed by a huge drop lower, and finally followed by a massive rally to close the day a bit higher than Friday's close, as shown on the following daily chart.

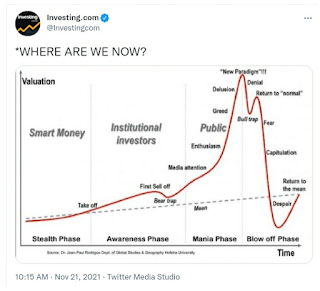
This volatile action triggered some interesting tweets...

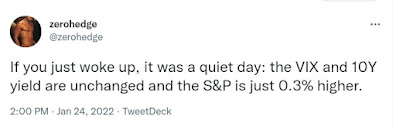
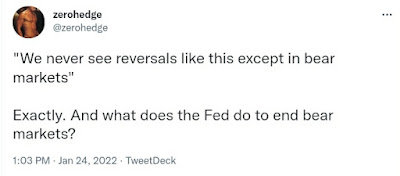
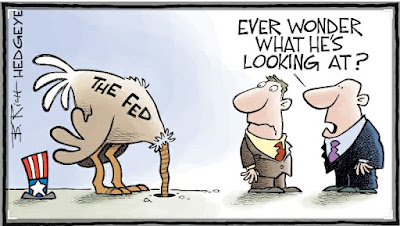
...and has created an "interesting" dilemma for the Federal Reserve to digest as they examine their next moves at their upcoming meeting this Wednesday.

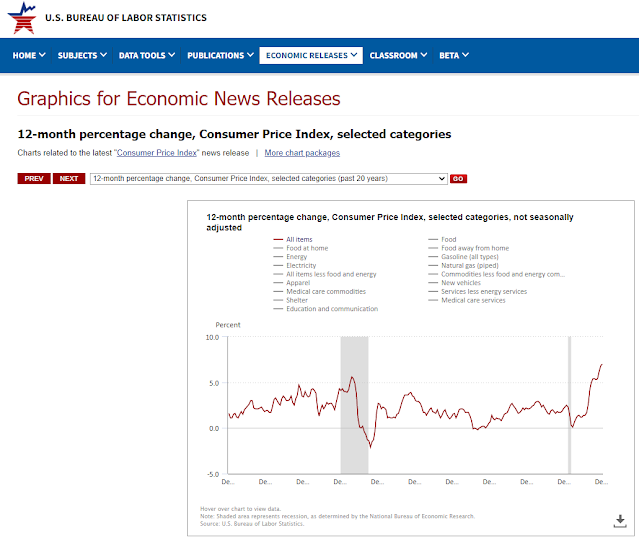
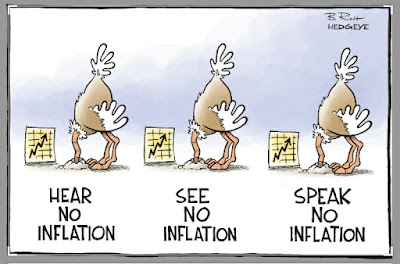
However, I can't see this influencing their dual mandate to maintain a 2.0% inflation target and stable prices (the U.S. inflation rate is already well above at 7.0% with no signs of abating) and to promote maximum employment (the current unemployment rate is 3.9%). 

Their current interest rate is 0.25% and is not a deterrent to curb out-of-control inflation.

If today's intraday volatility does unduly influence them, they're not performing (what should be) their impartial job of properly managing their dual mandate, in my opinion.

* UPDATE January 26...

The Fed has failed to carry out their dual mandate, once again...inflation will continue to rage.

Not hiking interest rates now is foolish and signals to investors and the rest of the world that the U.S. economy is too weak to withstand higher rates

Therefore, this does NOT justify higher equity prices, in my opinion

They will have to revert to drastic measures soon to make any meaningful dent in out-of-control inflation, because they've waited far too long. They should have stopped their bond-buying spree and begun to raise rates months ago.


Morning comments made prior to the FOMC statement indicate a growing concern over the Fed's lack of leadership in calming inflation...President Biden has already thrown Chairman Powell under the bus on this issue.

However, the President is not without blame in contributing to inflation. He needs to:

  • REVERSE his executive actions when he (1) restricted oil and gas exploration and drilling on federal lands and imposed further regulations on that industry, and (2) withdrew the approval of the Keystone XL pipeline from Canada...those two actions on Day One of his presidency triggered and contributed to the inflation spike.
  • STOP paying people to stay home and to get back to work.
  • STOP flooding the economy with fiscal stimulus programs and exploding the national debt (now at $29.88 Trillion).
  • START implementing policies that tighten national security, rather than continue with those that are weakening it...e.g., resume building the southern border wall and enforce existing immigration laws.

Both men need to start doing their jobs properly...otherwise, a GOP majority win in both the House and Senate is guaranteed in the November mid-term election

However, with Biden's overall approval rating already in the 30's because of his reckless actions (Afghanistan), and his radical socialist policies and agenda, a massive GOP win is likely to occur, anyway.


* UPDATE January 27...

It seems as though it doesn't really matter to Chairman Powell that inflation is hitting lower-income people hard...so, who's looking out for them and, really, what use is the Fed? 😕

Expect:

  • the market chaos to continue,
  • the lower class continue to suffer under crushing inflation,
  • the Misery Index continue to rise, as described in my post of January 26,
  • while the Fed and the President "fiddle and fluff over" the harsh results/realities of their actions/inactions.


GOLD: Gathering Strength

I last wrote about GOLD in my post of December 21, 2021.

Since then, it's remained caught in a large sideways consolidation zone, as shown on the following charts.

What has happened, however, is that the William's Alligator has begun to curl upward on the daily and weekly timeframes...hinting of building strength.

Major resistance remains at 1,850 and major support at 1,750. Watch for a break and hold above or below those levels to confirm price direction for the coming days/weeks.


SPX: The Blowoff Phase Has Begun

Further to my post of December 6, 2021 on the SPX, the "Blowoff Phase" has begun, as shown on the monthly chart below. 

At the time of writing this post, today's low is 4221.54, which is January's low, so far, and is roughly a 12.4% correction from its all-time high of 4817.88, set during the first week of January.

Please refer to my subsequent posts here, here, herehere, and here for further insights, as well as price targets and support/resistance levels.

By the way, the channel "mean" is just below the S2 pivot level of 3266 mentioned in my January 1, 2022 post...a target/major support level.


Sunday, January 23, 2022

ARKK: Bears Still In Control

An inverted cup and handle began to form in November of 2020 on ARK Innovation ETF (ARKK), as shown on the following daily chart.

A bearish moving average Death Cross formed on June 30, 2021 and never reversed after that date.

The bears are still firmly in control of this ETF.

As of last Friday, price is sitting just above the 50-month MA (70.696) and just below the 200-week MA (73.404).

A break and hold below 70.00 could send it down to 40.00, or lower to its IPO price around 20.00.


Bearish Death Cross Forms on Bitcoin

I last wrote about Bitcoin (BTC/USD) in my post of December 29, 2021.

A bearish moving average Death Cross has formed on the daily timeframe, as shown on the chart below.

A break and hold below 30,000 could send price crashing down to 20,000, or lower.

By the way, my above-mentioned post also compared the price action of Virgin Galactic Holdings Inc. (SPCE) with Bitcoin's.

Since that time, SPCE has continued its plunge downward to its close last Friday of 8.47...below its IPO price of 10.50 in September of 2017.

We'll see if Bitcoin's fate is, ultimately, similar to that of SPCE!


Saturday, January 22, 2022

TECHNOLOGY SECTOR: Approaching Terminal Velocity

* See UPDATE below...

I last wrote about FNGU (an exchange-traded note that tracks 3x the daily price movement on an index of US-listed technology and consumer discretionary companies) in my post of December 20, 2021.

As you can see from the following monthly chart, it failed to recapture and hold above the 33.00 level, mentioned therein, and closed at 25.74 on Friday.

It's approaching a price support zone from 20.00 to 25.00. We may see it attempt to stabilize somewhere within this zone in the coming days.

If not, a drop and hold below 20.00 could be catastrophic for the Technology Sector.

The ten stocks that make up FNGU are shown on the following 1-year daily charts.

Most of them are at or near price support, with the exception of TWTR, which is well below for the year.

The following daily ratio chart of the NDX:VXN ratio shows that a bearish moving average Death Cross formed several days ago, and price has fallen below major support of 500.

I noted in my post of January 21 that a Death Cross had also formed on the SPX:VIX ratio and that the 'sell the rip' traders had overtaken the 'buy the dippers.' The same is true for this ratio.

If the NDX:VXN drops and holds below 400, its next major support level sits at 300, followed by 250 and 200, respectively.

In conclusion, if FNGU falls and holds below 25.00, and if the NDX:VIX ratio falls and holds below 400, and if the ten FNGU stocks fall and hold below their near-term price support levels, I wouldn't be surprised to see FNGU retest the lower edge of its support zone at 20.00.

A drop and hold below 20.00 on FNGU and below 300 on the NDX:VXN ratio could be catastrophic for the Technology Sector.

Keep an eye on the price action and support levels on the SPX and SPX:VIX ratio described in the aforementioned post for possible corroborating clues in this regard.

* UPDATE February 2...

Apparently TWTR has been replaced by MSFT in the FNGU ETN basket of stocks. The following revised one-year daily chartgrid of FNGU and its 10 stocks incorporates this update.