* See UPDATES below...
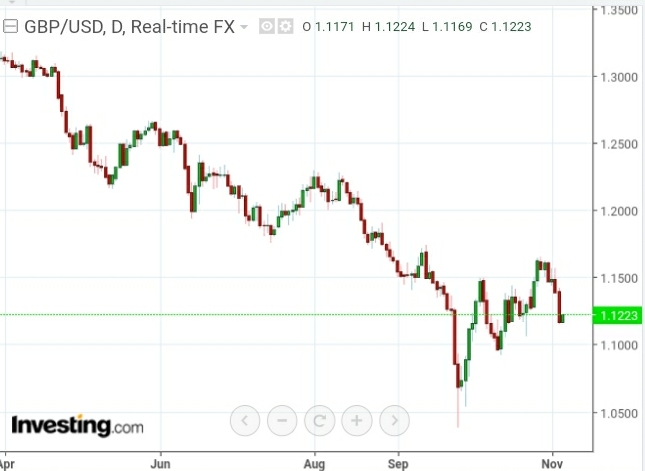
The British Pound (GBP/USD) is taking a beating in overnight trading as it crashed to a new all-time low of 1.0384, so far...below the record low set in early 1985.
Its long-term major support (breaking point) of 1.4000 was broken in April of 2016, and it never recovered.
As I mentioned in my post of September 24, the US Dollar has strengthened this year against all other foreign currencies, including GBP/USD.
Unless GBP/USD retakes and holds above 1.4000, expect more volatile swings and, possibly, a break below parity.
* UPDATE Sept. 26...
Will the Bank of England raise rates aggressively before their next scheduled meeting on Thursday, November 3 to stem the rout in the Pound Sterling?...
* UPDATE Oct. 18...
Notwithstanding the recent bounce in the GBP/USD, there is still much trouble ahead in the UK...for PM Liz Truss...the Pound Sterling...and UK Gilts.
No doubt, volatility will continue to play havoc in their bond, currency and stock markets for some time.
* UPDATE Oct. 19...
UK's inflation is still rising...now at a new 40-year high of 10.10%.
And, GBP/USD has dropped on today's inflation report.
The Balance of Power has shifted, once again, back to the Sellers on the daily timeframe.
Inasmuch as, no 'quick fix' is being provided at this time by new PM Liz Truss, expect volatility to continue in the Pound Sterling, UK Gilts, and UK FTSE 100 Index.
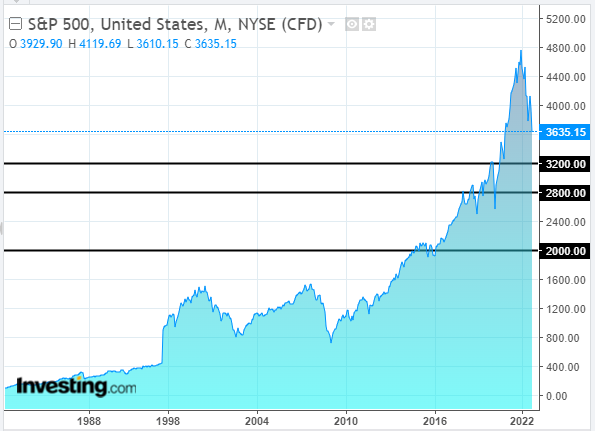
Historically, the FTSE 100 Index has had difficulty holding and increasing gains above 5000, as shown on the following monthly chart...which forms a major support level.
A drop and hold below 6000 could see a retest of 5000, or lower.
So, yeah...more trouble for PM Liz Truss. 😮
Who's in charge?
What a mess! 😕
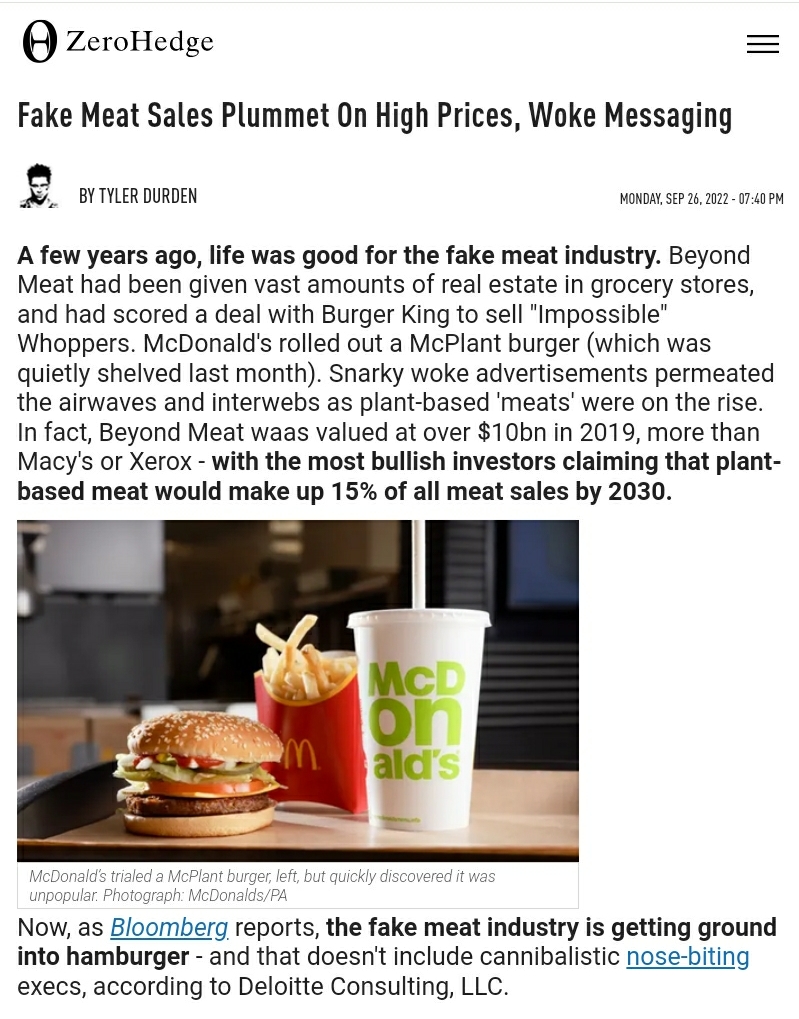
ZeroHedge excerpt
ZeroHedge excerpt
* UPDATE Oct. 20 & 21...
Well, that didn't take long...she's gone...who's next?
UK markets are still stuck in limbo (range bound).
Overall, it's still a mess...as theories emerge about what happened and/or what's going on, politically.
* UPDATE Oct. 25...
What could possibly go wrong?...🤔
* UPDATE Oct. 26...
Well...that didn't take long! 😯
Here's a prime example...Sunak's following the WEF doctrine, unlike Liz Truss, who reversed the ban during her short stint as PM.
So, which PM was/is looking after the best interests of the UK, rather than those of the WEF? 🤔
What/who else will be banned next?
* UPDATE Oct. 31...
If the following is true, keep an eye on GBP/USD (for signs of increased weakness).
It lost ground in today's trading, as the Balance of Power flipped to the Sellers, as shown on the following weekly chart.
* UPDATE Nov. 3...
This is devastating news for the UK...coming from the Bank of England.
Perhaps that explains one of the the reasons that the GBP/USD has struggled to gain sustained traction on direction, since it hit its record low of 1.0384 on September 26...as it has experienced wild daily whipsaw swings on its attempted rally, since then.
N.B. Watch for signs of a contagion of weakness spreading to other countries and currencies.