WELCOME

Welcome and thank you for visiting!

The charts, graphs and comments in my Trading Blog represent my technical analysis and observations of a variety of world markets...
* Major World Market Indices * Futures Markets * U.S. Sectors and ETFs * Commodities * U.S. Bonds * Forex

N.B.
* The content in my articles is time-sensitive. Each one shows the date and time (New York ET) that I publish them. By the time you read them, market conditions may be quite different than that which is described in my posts, and upon which my analyses are based at that time.
* My posts are also re-published by several other websites and I have no control as to when their editors do so, or for the accuracy in their editing and reproduction of my content.
* In answer to this often-asked question, please be advised that I do not post articles from other writers on my site.
* From time to time, I will add updated market information and charts to some of my articles, so it's worth checking back here occasionally for the latest analyses.

DISCLAIMER: All the information contained within my posts are my opinions only and none of it may be construed as financial or trading advice...please read my full Disclaimer at this link.

Dots

* If the dots don't connect, gather more dots until they do...or, just follow the $$$...

Beach Drinks

Beach Drinks

ECONOMIC EVENTS

UPCOMING (MAJOR) U.S. ECONOMIC EVENTS...

***2026***
* Wed. June 17 @ 2:00 pm ET - FOMC Rate Announcement + Forecasts and @ 2:30 pm ET - Fed Chair Press Conference

*** CLICK HERE for link to Economic Calendars for all upcoming events.

Showing posts with label 10 YR Treasury Yields. Show all posts

Wednesday, November 02, 2022

U.S. Fed: "No Pause" To Refresh

* See UPDATE below...

US Fed Chairman Jerome Powell emphasized several times during his press conference, following today's FOMC rate hike of 0.75% to 3.75%-4%, that the Fed is NOT pausing their rate hikes, as they're focused on raising rates until inflation comes back down to their target 2% rate...

"It's premature to discuss pausing and it's not something we're thinking. That's really not a conversation to be had now. We have a ways to go."

He referred to the US Core Consumer Price Index (CPI) YoY and US Core PCE Price Index YoY multiple times during the Q&A period. They are highly elevated at 40-year levels, as shown on the following graphs, and there is no hint they are falling any time soon...particularly as the costs of oil and gas show no signs of abating, and they affect the price of everything.

The SPX plunged 134.75 points from its high today of 3894.55 and closed at its low of the day at 3759.69.

So, in spite of the constant barrage of "We think the Fed's going to pause or pivot, soon..." from TV analysts and pundits, it seems that the Fed ignored all of that rhetoric, once again, to focus on their job of reducing inflation.

How many times will these talking heads cry wolf? And, how many times will the market take their bait

As long as that scenario keeps repeating itself, ad nauseam, we'll continue to see "Dead Cat Bounces" occur in the SPX bear market...as well as volatile whipsaw intraday swings.


ZeroHedge excerpt


SPX Daily

WTI Crude Oil Monthly

* UPDATE Nov. 6...

What happens when bad news is bad news?...🤔


Seeking Alpha excerpt

Seeking Alpha excerpt


Monday, October 17, 2022

U.S. Bonds, Yields and Volatility Near Extreme Levels

* See UPDATES below...

The following monthly charts show the extreme moves (plunges and spikes) and volatility experienced this year in the 10-Year T-Note (TYZ2), the 10-Year Treasury Yield (US10YT), and the MOVE Index (MOVE) (which measures Treasury rate volatility through options pricing).

They are all trading near a critical support or resistance level, shown in pink.

If the MOVE Index blows through 160.00, we may see TYZ2 drop to 100.00, or lower, and US10YT spike up to 5.00, or higher...so, keep an eye on that one.


The following tweets are from the weekend...so what's going on in the bond market?


More interesting tweets...serious problems abound, and President Biden seems oblivious to all of them...


* UPDATE Oct. 23...

An interesting take on US Bonds...

2-Yr, 5-Yr, 10-Yr & 30-Yr US Bonds have begun to rally, as shown on the following 20-day 60-min. intraday chartgrid...but, it's too early to tell if they have bottomed.

* UPDATE Oct. 31...

Oops!...🤔

Keep an eye on (Nov. 2interest rates and "Fed-speak!"


* UPDATE Nov. 1...

+160.3% at its peak in 1987...to -1.8% now.

I repeat...what's going on in the bond market? 😲


Saturday, October 15, 2022

BlackRock's Parabolic Plunge

* See UPDATES below...

The following monthly chart of BlackRock Inc. (BLK) shows that it has had difficulty sustaining gains above 400.00, when it broke above that level in April 2017...from a base that began to form in October 2013 at 300.00.

It hit a high of 973.16 in November 2021, before plummeting to a low of 504.64, so far, this month.

As of this week's close, BLK is down by 41.80% from its record high.


Apparently, the company is ready to invest in U.S. energy pipelines, once those projects are green-lit by the Biden government...expanding its holdings beyond ESG-aligned investments.

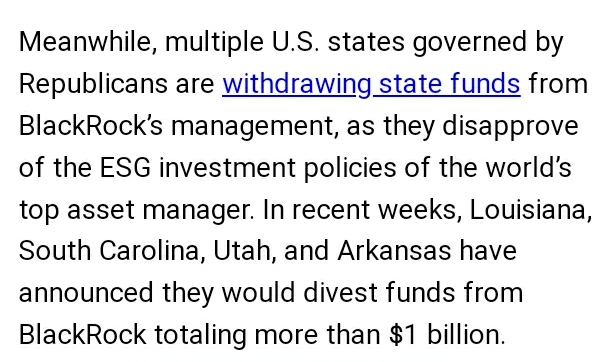
It seems like those "Environmental Social Governance" investments haven't been so profitable for BlackRock's shareholders, after all...since many are withdrawing their funds from their management.

Until the US Fed is finished raising interest rates to combat 40-year high inflation, and until the Biden administration is ready to reverse its devastating war against fossil fuelsBLK will, no doubt, experience further pain and losses, along with the US equity market, in general, as described in my post of October 14.

BLK may retest 500.00, or even drop further to 400.00...or lower, yet.


Oilprice excerpt

Oilprice excerpt


ZeroHedge excerpt

N.B. The following monthly charts of XLF plus 9 major banks, including BLK, depict all of their struggles, particularly this year. (I initially warned about bank bubbles bursting on April 10, 2021.)

I've also included CS and DB...about which I've recently written here, inasmuch as they have their own issues.

The following four graphs depict percentages gained/lost over several different time periods.

Overall (apart from CS), BLK has lost the most, on a percentage basis, over three of the four timeframes. It was flat this past week.

Its comparative weakness is notable and may hint of some underlying problem that hasn't surfaced...yet. 

One to keep an eye on over the coming weeks/months.

Nov. 12, 2021 to Oct. 14, 2022

YTD

One Month

One Week

* UPDATE Nov. 5...

Keep an eye on the banks (over-leveraged) mentioned in the following article, and above, for signs of accelerating weakness to signal more downside for equities and bonds...assuming global Central Bankers continue to raise rates and with their QT program, to combat out-of-control inflation.

I wonder how Americans would feel about another major bank bailout, as a repeat of what transpired in 2009? 😕


ZeroHedge excerpt (CONCLUSION)

Monthly Comparison chart of 
Deutsche Bank & US 10-Year Yields

Monthly Comparison chart of 
BlackRock Inc. & US 10-Year Yields

* UPDATE Nov. 5...

The implementation of ESG criteria by companies may be illegal...for several reasons...


ZeroHedge excerpt

* UPDATE Dec. 1...

BlackRock ditches ESG fund...due to "lack of interest, amid poor performance."

I guess the penny has finally dropped. 😕

* UPDATE Dec. 2...

Important Twitter thread on ESG and Blackrock...

* UPDATE Dec. 9...

BlackRock's forecast for 2023 is rather dire...

* UPDATE March 31, 2023...

Reality about the viability and legality of ESG-related rules for companies in which they invest, is beginning to set in on investment firms, such as BlackRock, as detailed in the following ZeroHedge report.

* UPDATE May 1...

The following article is 'illuminating'...remember SIFI (pertaining to BlackRock) in the days/weeks ahead...


ZeroHedge excerpt

Following the latest 'dead-cat-bounce,' a drop and hold below 600 could see BLK retest 400, or lower, as I mentioned at the outset, as shown on the following monthly chart.