WELCOME

Welcome and thank you for visiting!

The charts, graphs and comments in my Trading Blog represent my technical analysis and observations of a variety of world markets...
* Major World Market Indices * Futures Markets * U.S. Sectors and ETFs * Commodities * U.S. Bonds * Forex

N.B.
* The content in my articles is time-sensitive. Each one shows the date and time (New York ET) that I publish them. By the time you read them, market conditions may be quite different than that which is described in my posts, and upon which my analyses are based at that time.
* My posts are also re-published by several other websites and I have no control as to when their editors do so, or for the accuracy in their editing and reproduction of my content.
* In answer to this often-asked question, please be advised that I do not post articles from other writers on my site.
* From time to time, I will add updated market information and charts to some of my articles, so it's worth checking back here occasionally for the latest analyses.

DISCLAIMER: All the information contained within my posts are my opinions only and none of it may be construed as financial or trading advice...please read my full Disclaimer at this link.

Dots

* If the dots don't connect, gather more dots until they do...or, just follow the $$$...

Loyalty

Loyalty

ECONOMIC EVENTS

 UPCOMING (MAJOR) U.S. ECONOMIC EVENTS...

***2024***
* Fri. April 5 @ 8:30 am ET - Employment Data
* Wed. April 10 @ 2:00 pm ET - FOMC Meeting Minutes
* Wed. April 17 @ 2:00 pm ET - Beige Book Report
* Wed. May 1 @ 2:00 pm ET - FOMC Rate Announcement + Forecasts and @ 2:30 pm ET - Fed Chair Press Conference

*** CLICK HERE for link to Economic Calendars for all upcoming events.

Monday, January 17, 2022

Death Cross Forms On SPX:VIX Ratio

I last wrote about the SPX in my 2021 Market Wrap-Up and 2022 Forecast on January 1.

The SPX closed (around 20 points below the 50-day moving average) at 4662.85 last Friday, as shown on the following daily chart. The 200-day moving average is well below at 4420.84, which is slightly above the yearly Pivot Point for 2022 of 4412.61 (identified in my above-mentioned post). Both moving averages are still in uptrend.

The SPX uptrend is wavering and price is caught in a large and tightly bunched-up consolidation range.


A 50/200-day moving average Death Cross just formed on the SPX:VIX Ratio, as shown on the daily ratio chart below...at variance with the moving averages on the SPX.

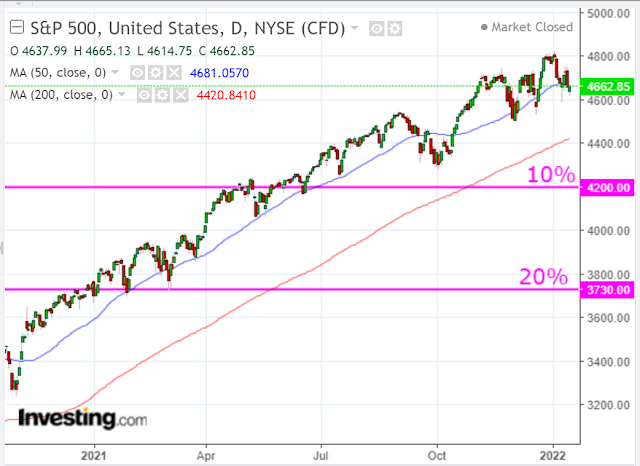
It's a warning signal that weakness has crept into the SPX and we may see it pull back or correct soon.

A 10% drop would send it down to 4200, while a 20% drop would take it to 3730.

Alternatively, it may be a bear trap.

These two scenarios should become more clearly defined after the next Fed meeting on January 26.

In the meantime, trading will likely remain volatile and whippy...especially below 4700.