WELCOME

Welcome and thank you for visiting!

The charts, graphs and comments in my Trading Blog represent my technical analysis and observations of a variety of world markets...
* Major World Market Indices * Futures Markets * U.S. Sectors and ETFs * Commodities * U.S. Bonds * Forex

N.B.
* The content in my articles is time-sensitive. Each one shows the date and time (New York ET) that I publish them. By the time you read them, market conditions may be quite different than that which is described in my posts, and upon which my analyses are based at that time.
* My posts are also re-published by several other websites and I have no control as to when their editors do so, or for the accuracy in their editing and reproduction of my content.
* In answer to this often-asked question, please be advised that I do not post articles from other writers on my site.
* From time to time, I will add updated market information and charts to some of my articles, so it's worth checking back here occasionally for the latest analyses.

DISCLAIMER: All the information contained within my posts are my opinions only and none of it may be construed as financial or trading advice...please read my full Disclaimer at this link.

Dots

* If the dots don't connect, gather more dots until they do...or, just follow the $$$...

Paris Cafe

Paris Cafe

ECONOMIC EVENTS

UPCOMING (MAJOR) U.S. ECONOMIC EVENTS...

***2026***
* Wed. July 29 @ 2:00 pm ET - FOMC Rate Announcement + Forecasts and @ 2:30 pm ET - Fed Chair Press Conference

*** CLICK HERE for link to Economic Calendars for all upcoming events.

Showing posts with label Volatility. Show all posts

Friday, June 05, 2026

BITCOIN: Chaos

Bitcoin in a nutshell...CHAOS...over and over again.

Not for the faint of heart! 🤢


UPDATE:

Bitcoin's extreme volatility renders it unsuitable for normal technical analysis, as has been done in the following report.

IMHO it's simply an overhyped 'kleptocurrency'...as are the rest of these cryptocurrencies.


Thursday, January 23, 2025

SOFTBANK: Boom Or Bust?

In 2022, I posted several articles on SoftBank's (SFTBY) reckless business investments and failures, which can be found at this link.

I'm not convinced that their new AI partnership with "Stargate" members will prove to be any more profitable for them than those, which were not...or that their investment will be any more wise than the others, which were not.

Time will tell.

This venture may be SoftBank's biggest black hole investment yet..."no clear goal, no timeline, and no real way to measure it" also means no transparency...buyer beware.

Overlayed on the following monthly chart of SFTBY are a number of technical drawings depicting a long-range rising channel, a "chaos zone," and a "froth zone."

The current price is currently trading in the upper portion of the "froth zone" and is at the top of the channel.

Failure of price to rise and hold above the upper levels of the "froth zone" and channel at 35.00 could see some volatile swings in either direction within this zone, until it becomes clearer to investors as to the viability and sustainability of SoftBank's latest capital venture, described above.

* UPDATE February 12...

The following X post is not good news for SoftBank.

As I write this update at 1:18 pm ET, SFTBY is trading at 30.76, down from 33.90 since January 23.

It seems that others are also concerned over SoftBank's investment decisions.

* UPDATE July 22...

Unless this AI partnership can withstand decades of heavy financial losses before any profits more than cover them, if ever, I'd say that SoftBank's investment is on the way to BUST.


Source: ZeroHedge


Tuesday, December 10, 2024

BITCOIN: Floating On Air

A simple observation on Bitcoin reveals that it's floating on air following its parabolic breakout above 70,000 during the week of November 4, as shown on the following weekly chart.

A break and hold below 90,000 could see a retest of major support at 70,000, or, at least, a pullback from its high of 103,990 to around 86,995 (50% of the difference between 103,990 & 70,000 = 16,995) where we may see it consolidate for awhile before, either, resuming its upward movement or losing steam to fall to 70,000, or lower.

The one certainty or constant characteristic of this 'wild-west-like' trading instrument is that it has always been dominated by wild and extreme, volatile swings in both directions. 

I don't see that chaotic price action changing or moderating anytime soon...and is, thus, predictable.


Tuesday, December 26, 2023

2024 MARKET FORECAST: 'Black Swan Event' In 2024 It Is Then...

Perhaps this CBS news reporter's prediction of a 'Black Swan Event' for 2024 is not so far off...either when it comes to U.S. national security, or in the stock markets...especially when one considers the reluctance of traders/investors to convincingly push markets above the December 2021 high for the past two years, as shown on the following monthly S&P 500 Index (SPX) chart.


Perhaps such reluctance stems from Joe Biden's epic multiple failures as a leader since he became President in January of 2021, about which I've written extensively...some of these include:


CONCLUSIONS:

As I hypothesized in my 2023 Market Forecast, and, as long as Joe Biden remains President, I think we'll see more whipsaw, volatile moves occur in all markets in 2024, until such a 'Black Swan event' does occur...particularly since it's a presidential election year and each one has become more contentious and controversial. 

Furthermore, this article highlights the extreme importance of this election, inasmuch as global instability is at stake. 

N.B. By the way, add to this, the damning Special Counsel's conclusions and report (released to the public on February 8, 2024) -- where he highlighted President Biden's mental unfitness to stand trial for his willful and unlawful retention and disclosure of classified materials when he was a private citizen during his post Vice-Presidency -- and you have a recipe for a global disaster as long as he remains President.

Any push to new highs may be met with a swift retreat to new lows...possibly to retest 3200, or lower.

HAPPY NEW YEAR AND BEST OF LUCK IN 2024!

* UPDATE March 21, 2024...

It seems like market players have refused to entirely release their grip, so far, on the 'greed' and 'delusion' segment of the Perpetual Stock Market Cycle, as noted in the following monthly comparison chart of the SPX and BITCOIN.

Keep an eye on the near-vertical rise of both of these...which one will topple first?


And, with Democrats continuing to plow forward with their far-left economically-destructive Green New Deal, about which I warned 5 years ago in this post, it's only a matter of time before either one, or both, topple from their lofty heights.


N.B. Even politically-centrist Elon Musk's views are now accused of being right-wing by these extreme far-left Democrats, as described in this article...common sense is foreign to them.

And, the (sensible) meek shall regain control...eventually...


😏

P.S. For more examples of potential Black Swan events, check out my article here.


Thursday, May 04, 2023

Selling Spreads Across U.S. Regional Banks

* See UPDATES below...

Further to numerous articles that I've recently posted describing the collapse of several Regional Banks, the number of shareholders divesting themselves of shares in other Regional Banks is accelerating.

The following graphic contains a list of the top 10 holdings of the Regional Banking ETF, KRE. All of them are down, so far, today.

KRE has continued its plunge down to the 2020 COVID-19 pandemic median price zone, as shown on the following monthly chart.

Inasmuch as it represents a snapshot of overall sentiment in the regional banks, I'd say the current state of these banks, in general, is pretty weak.

No one should be surprised that this particular sector of banks is weak, inasmuch as I warned about the state of U.S. banks, in general, in my post of April 10, 2021. As it happens at that time, KRE was close to making its all-time high of 78.81 (set in January of 2022), before it began to drop.

Even though its drop was initially choppy, it's been falling off a cliff since March of this year.

It's trading in a large sideways 'Chaos Zone.' It's had difficulty holding onto and increasing its gains made above 30.00 since January of 2013. It's also trading below its IPO opening price of 48.09 made in June of 2006...right before the 2007/08 Financial Crisis.

I anticipate that KRE will bounce around within that 'Chaos Zone' for some time. However, a drop and hold below 30.00 would signal much more serious consequences for the entire banking system, not only in the U.S., but globally, as well...as occurred in 2007/08/09.

N.B. Given these facts, it's odd that Fed Chairman J. Powell still insists that these banks are secure, when their representative ETF is plainly portraying great weakness...below that leading up to the 07/08 Financial Crisis

Surely one has to wonder if that contagion will spread to the larger banks and the 29 banks deemed too-big-to-fail by the Financial Stability Board of the G20 in 2011. Note that Credit Suisse did, subsequently, fail, as described in my recent posts.

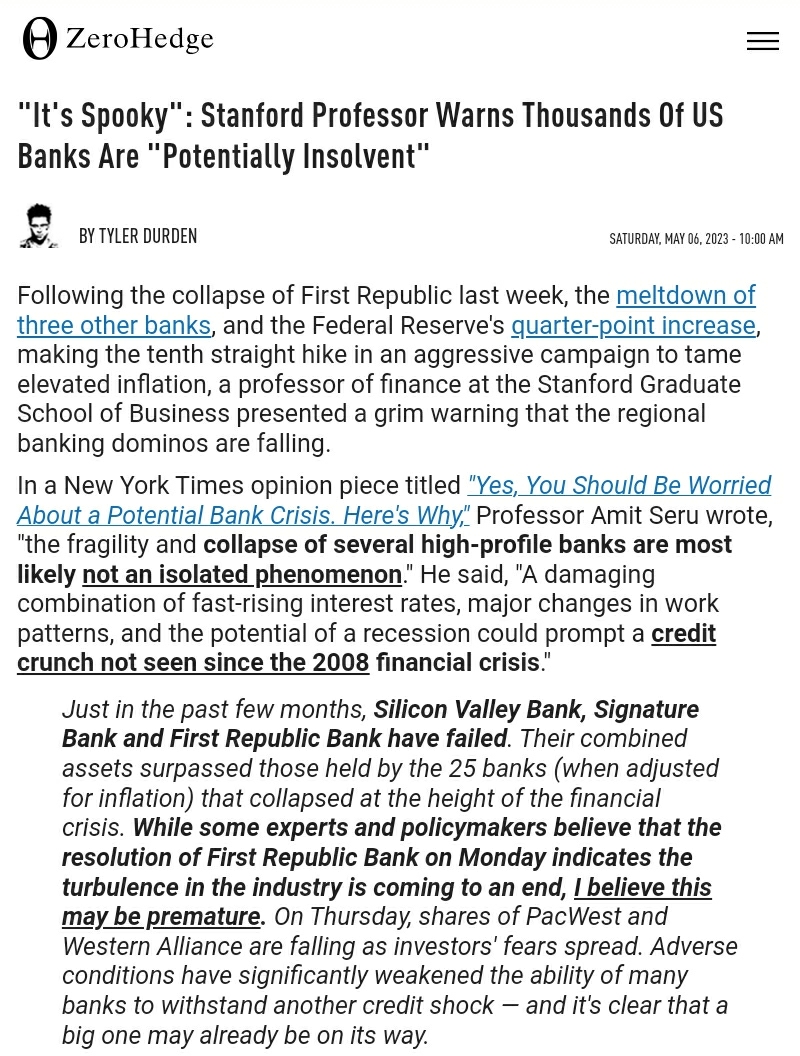
Today's ZeroHedge article has some answers in that regard.

* UPDATE May 5...

And...(lots of) food for thought...(HINT: keep your money safe!)...


(Editor's Note: SATIRE 😏)

* UPDATE May 6...

"It's spooky. Thousands of banks are underwater.

Let's not pretend that this is just about Silicon Valley Bank and First Republic. A lot of the US banking system is potentially insolvent."


Thursday, April 06, 2023

De-Dollarization of U.S.$?

* See UPDATES below...

Several articles have been written recently about the possible de-dollarization of the U.S. Dollar, as shown below.


While I'm not an expert on the matter to say "Yay" or "Nay," I can provide the following monthly charts of the U.S. Dollar (DX) and Gold (GC).

The charts show an inverse correlation to each other. Furthermore, their major resistance and support levels are depicted thereon...as noted below:

  • DX: 107.00, 100.00, and 90.00
  • GC: 2000, 1800, 1600 and 1400

Very simply, keep an eye on whether or not DX is able to hold above the 100.00 level. If not, we could see it re-test 90.00, or lower, if GC holds above 2000 and gathers momentum. However, GC is nearing a bearish triple-top formation, so it may face stiff resistance around its prior high of 2089.20 set in August 2020. If it spikes through that level, with sustained force, we could see buyers pile into Gold and sell the Dollar, especially if traders/investors view the long-term Gold formation as a bullish cup & handle pattern.

BUT, I think we'd need to see some sort of major global catalyst occur to produce such a buying and selling frenzy. Exactly what that would be remains to be seen.

However, it's worth monitoring their movements over the coming weeks for hints of sustained rising volatility and potential chaos in these and other world markets (equities, ETFs, bonds, currencies, commodities, and crypto currencies).

N.B. For a further detailed analysis that I recently published on Gold, please refer to my post of December 6, 2022, wherein I outlined a technical case to be made for Gold to reach $3000, in accordance with one of Saxo Bank's "Outrageous Predictions for 2023."


* UPDATE April 20...

Countries dumping the U.S. Dollar...


So, will we see China's Yuan become the dominant international reserve currency, if the following global GDP projection materializes?

* UPDATE April 22...

As U.S. debt grows and the U.S. Dollar weakens, the value of Gold should increase over time...


* UPDATE April 24...

As a hedge against U.S. sanctions, many foreign countries are buying Gold...

* UPDATE APRIL 25...

In emerging markets, Gold is surpassing the U.S. Dollar, as a safe haven...

* UPDATE April 28...

More on de-dollarization...