WELCOME

Welcome and thank you for visiting!

The charts, graphs and comments in my Trading Blog represent my technical analysis and observations of a variety of world markets...
* Major World Market Indices * Futures Markets * U.S. Sectors and ETFs * Commodities * U.S. Bonds * Forex

N.B.
* The content in my articles is time-sensitive. Each one shows the date and time (New York ET) that I publish them. By the time you read them, market conditions may be quite different than that which is described in my posts, and upon which my analyses are based at that time.
* My posts are also re-published by several other websites and I have no control as to when their editors do so, or for the accuracy in their editing and reproduction of my content.
* In answer to this often-asked question, please be advised that I do not post articles from other writers on my site.
* From time to time, I will add updated market information and charts to some of my articles, so it's worth checking back here occasionally for the latest analyses.

DISCLAIMER: All the information contained within my posts are my opinions only and none of it may be construed as financial or trading advice...please read my full Disclaimer at this link.

Dots

* If the dots don't connect, gather more dots until they do...or, just follow the $$$...

Paris Cafe

Paris Cafe

ECONOMIC EVENTS

UPCOMING (MAJOR) U.S. ECONOMIC EVENTS...

***2026***
* Wed. July 29 @ 2:00 pm ET - FOMC Rate Announcement + Forecasts and @ 2:30 pm ET - Fed Chair Press Conference

*** CLICK HERE for link to Economic Calendars for all upcoming events.

Showing posts with label Emerging Markets ETF. Show all posts

Sunday, August 28, 2022

Will The PHO ETF Sink Or Swim?

The following monthly chart of the Invesco Water Resources ETF (PHO) shows that price has been under stress since January 2022.

This followed a lengthy and unprecedented amount of bullish momentum and rate-of-change activity in the months from November 2020 until this year.

It pushed the price up from a low of 41.21 to a high of 61.07 before dropping to a low of 43.22 by this past June...nearly wiping out all of its gains since then.

If global water resources remain under pressure and continue to dry up, as described in the Zero Hedge article below, we may see PHO retest the 40.00 level, or drop lower.

Keep an eye on a potential increase of bearish momentum and rate-of-change to arise on this timeframe for clues of further weakness ahead for PHO.

Alternatively, look for the reverse scenario occurring to signal a possible retest of the prior monthly swing high, or push higher.


Tuesday, July 26, 2022

MSCI World Index In Freefall

* See UPDATES below...

The MSCI World Index has been in freefall since January, as shown on the following monthly chart.

Major support sits at 2000, while longer-term supports lies at 1600.

Threats of world-wide recession are looming, as described in the following article...


ZeroHedge excerpt

The following posts provide further details and warnings in this regard:

Trade with caution!

* UPDATE July 28...

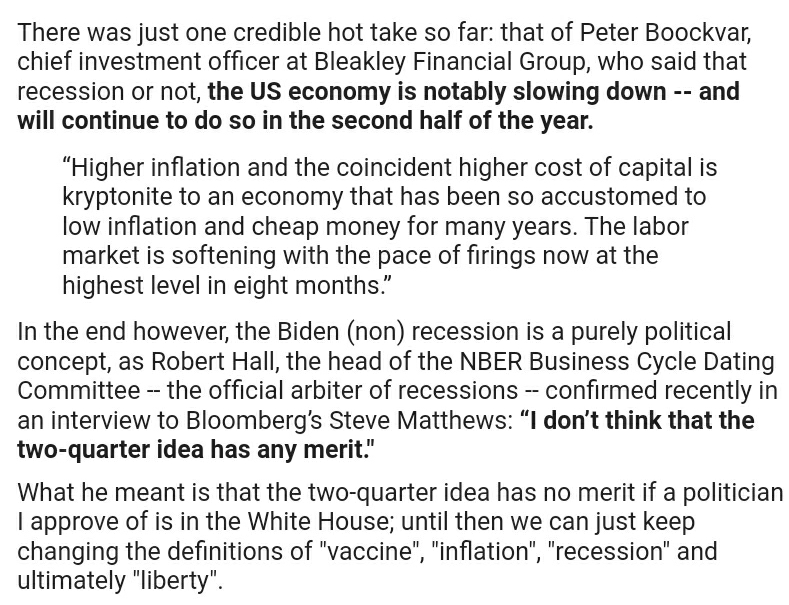
The U.S. is now in a technical recession...but the hucksters (including President Biden) would have you believe that technical data doesn't matter and that everything is rosy...


The following sums up the current chaotic state of affairs...choose your definition and place your bets accordingly, if you dare. 😏

ZeroHedge excerpt

* UPDATE July 30...

QUESTION: What do UNSDG, UNFAO, UNFS, as well as ESG, all have in common? 

ANSWER: Global (socialist) government control/ownership of land, food, water, housing, transportation/travel, health/welfare, energy, technology, banking/finances, education, media/social media & censorship, and goods production/distribution...via policies supported/adopted by the WEF, the UN, and major countries/unions, such as the UK, USA, EU, China, and Canada.

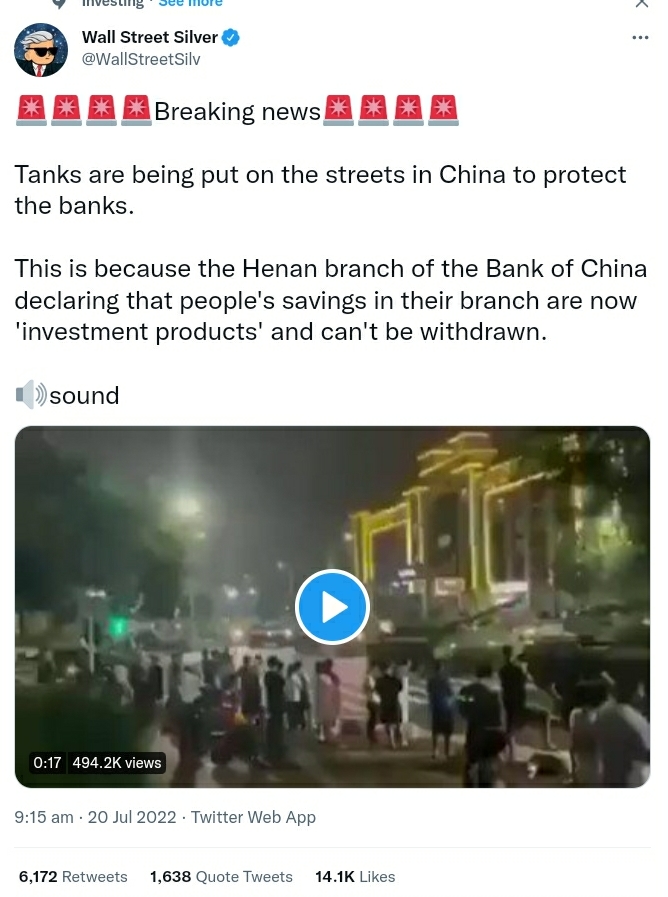
So, why have the Chinese and Bill Gates been buying up thousands of acres of farmland in the USA?

And why is the world in such a mess (with countries experiencing famines for the first time due to new restrictions/regulations on crop fertilizers and energy sources) -- and "transitioning" (global elites' favourite word du jour) toward an epic disaster -- under these principles/doctrines and practices (UN's "Agenda 2030")?


ZeroHedge excerpt


One hypocritical Hollywood elite, who hadn't done his research before hurling accusations of purported climate abuse, gets a lecture for his own abuse of the climate via his lavish lifestyle and his 'mega-toys.'

No doubt, there are many more privileged global elites who deserve to be labelled as 'hypocritical climate/environmental abusers,' a.k.a. 'pesky climate hustlers.' 🤔

* UPDATE Aug. 2...

So, yes, there are more hypocritical 'pesky climate hustlers'...10 of whom are identified in this article.

What's wrong with these people? 😟


* UPDATE Aug. 11...

Perhaps the following article explains the volatile, large-scale whipsaw price action of markets this year...the schizo push-pull swings between DM status (developed market status) versus EM status (emerging market status) within a variety of world markets, including the U.S.

So, what's the real status of any market? And, who gets to make those decisions?

If I were to hazard a guess...and, in a perfect world...I'd say it's anyone who controls the value and amount of money supply, as well as how well it's managed and invested for the future growth and benefit of the whole (the whole being a country's citizens).

However, since no one seems to be that altruistic and consistent in their thinking and actions, we're stuck with imperfect messaging (political spins and lies) and markets that trade on such 'massaged and fluid messaging'...but, which are also subject to real shocks and wild swings, regardless of their perceived (and fluid) DM/EM status.

So, plan your trade (within your timeframe)
and trade your plan.

* UPDATE Aug. 21...

Will that be CASH or CRASH?

Perhaps CASH is the safest way to go for the foreseeable future, inasmuch as holding CASH can also be part or all of your trading plan, depending on your risk tolerances within your trading timeframe and trading style (e.g., day trader, short-term swing trader, medium-term position trader, or long-term investor).

N.B. More information on weakness in world markets can be found here (regarding the SPX).


Sunday, July 24, 2022

EMERGING MARKETS ETF: EEM In Freefall

* See UPDATE below...

The Emerging Markets ETF (EEM) has had difficulty holding onto gains above 30.00 since January 2006, major support, as shown on the following monthly chart.

It's been in freefall since June 2021.

A sustained breach and plunge below that level could bring down global equities and financial stocks/ETFs...one to watch as a potential "canary in a coal mine."

* UPDATE Sept. 20...

Emerging markets continue to weaken as the U.S. Dollar gains strength...as of 2:20 pm ET, EEM's current price is 37.63.

We'll see what happens after the Fed raises interest rates at their meeting tomorrow.


Tuesday, April 27, 2021

What's Different About Emerging Markets This Time?

With the historical "mean" value of the Emerging Markets ETF (EEM) around 30.00, it's had a difficult time attracting barely any interest to sustain a serious rally above 44.00 during its trading tenure, as shown on the following monthly chart.

I'll wager that we'll see price fall back to 44.00, or lower to potentially 36.00, in short order...simply because, what's, fundamentally, different about these markets at the moment, or even in the next 6 or 12 months, that would sustain a push higher from the top of an already-parabolic spike that began a year ago...especially, as it's almost at major resistance (the high of 2007) before it got caught up in the 2008 financial crisis and market crash?


Wednesday, March 11, 2020

World Markets Thrash and Bash

N.B. The following chart and data screenshots were taken between 2:00 & 3:00 pm ET today (March 11)...

S&P 500 Index (SPX) Daily chart

SPX:VIX Daily ratio chart


Source: ZeroHedge.com

(he says an overall mortality rate of around 1%, but check out Italy's rate below)


Source: justthenews.com

2008/09 was a bank financial crisis.

This is an economic crisishealth crisis, and global supply-chain crisis, and one that is multiplying every several days in depth and breadth...not easily or quickly resolved by monetary and fiscal stimulus, particularly if they're not adequately and correctly targeted.


N.B. How U.S. markets closed...


SPX Weekly chart
N.B. There are 3 types of gaps in a trend: 
breakaway, continuation and exhaustion.
If the second gap holds, we could see much lower prices 
before the final exhaustion gap is made.


When will emerging markets (EEM) catch up with, or overtake, the U.S. market flush?


N.B.

Check out my recent articles on my Blog for details on charts and market gauges I'm monitoring during these chaotic times.

P.S.

Following President Trump's oval office (9:00 pm ET) address to the nation on the coronavirus pandemic, the S&P E-mini Futures Index (ES) nearly tagged 2600 right before trading was limit-down halted Wednesday night, as shown on the following daily chart.

Tomorrow should be interesting.

S&P 500 E-mini Futures Index (ES) Daily chart

S&P 500 E-mini Futures Index (ES) Monthly chart
Overnight trading almost touched the confluence (2600) of
the bottom of a long-term uptrending Andrew's Pitchfork channel 

(taken from the 2009 low to 2020's high)
and 
the 50% Fibonacci retracement level 
(taken from the 2016 low to 2020's high).


Click this link to view the video

Wednesday, August 15, 2018

A World Financial Battle Approaches

The first three ratio charts show:
  1. the U.S. Financial ETF (XLF) compared with the SPX,
  2. the European Financial ETF (EUFN) compared with the STOX50, and
  3. the Chinese Financial ETF (GXC) compared with the SSEC.
Each one's Financial ETF is weaker than its country's major index, and in the case of the EUFN and GXC ratios, are sitting at a major support level, while the XLF ratio is approaching major support.


The fourth ratio chart shows that the Emerging Markets Bond ETF (EMB) is stronger than its counterpart Emerging Markets ETF (EEM) and is approaching a major resistance level. (Note that EMB holds USD-denominated rather than local-currency debt, and eliminates direct currency risk for U.S. investors, but raises the possibility that a strengthening dollar or weakening local currency could make the debt harder to service, increasing credit risk.)


The next chart of the USD shows price approaching its next major resistance level at 97.50.


The next ratio chart shows the strengthening of the USD compared to EMB since the end of January. Price has a way to go before it hits its next major resistance level.


The last three ratio charts compare price of the STOX50, SSEC, and EEM to the SPX. They are all much weaker than the SPX, the STOX50 and EEM ratios are sitting on major support, and the SSEC ratio is trading below major support.


The last graph shows the percentages lost in the SPX, XLF, STOX50, EUFN, SSEC, GXC, EEM and EMB since they peaked around the end of January this year, as well as the gains made, conversely, in the USD.


Unless all of the three Financial ETFs firm up and attract new buyers soon, we'll see weakness continue, and possibly accelerate, in European, Chinese and Emerging Markets, potentially dragging U.S. equities down, as well. Keep a close eye on the USD as a potential flight-to-safety trade in such an event.

With respect to the U.S. market, I'd also refer you to my comments outlined during the past month in my posts here, here, here and here, which describe other factors I'm watching.