
* See UPDATE below...
My post of January 31 contained Pivot Point support and resistance levels/targets for February for the S&P 500 Index (SPX).
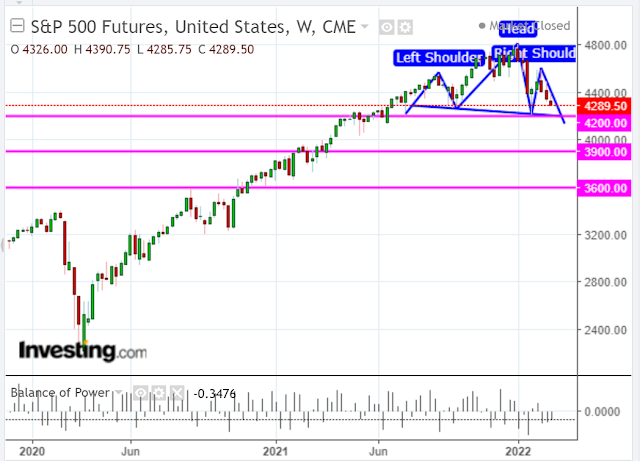
The following weekly chart of the S&P 500 Futures Index (ES) shows that price is in the midst of forming a bearish Head and Shoulders pattern.
The sloping neckline on this formation sits around 4200, which is just below February's SPX S1 support level.
Should price break below that level, the next levels of support are around 3900 and 3600, respectively...just below SPX S2 and S3.
The Balance of Power is still held by the sellers...and will continue if price breaks and holds below 4200.
If not, price will continue its volatile, directionless whipsaw swings in both directions within this typical topping pattern.
* UPDATE February 23 (11:00 pm ET)...
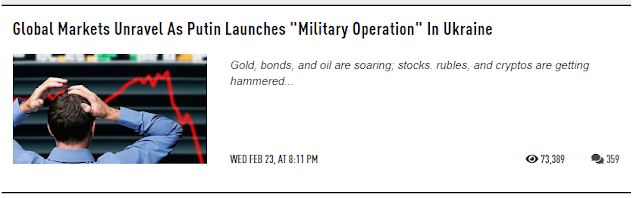
WAR: Russian President Vladimir Putin has declared war on and attacked Ukraine.

Fox News Pentagon correspondent Jennifer Griffin just reported that,"It's the beginning of a very serious full-scale military invasion of Ukraine, according to a senior U.S. administration official."
Markets around the world are plunging.
Follow ZeroHedge on Twitter @zerohedge for live commentary.
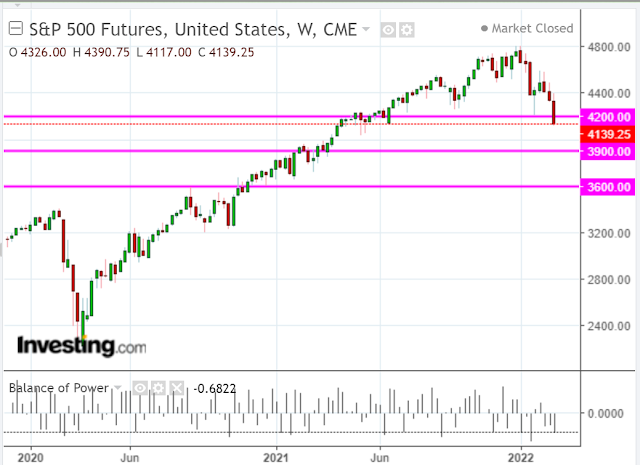
As at 11:00 pm ET, the S&P 500 Futures Index (ES) has sliced through the Head & Shoulders neckline at 4200 and is trading well below, as shown on the following weekly chart.
The next major support level lies at 3900.
SO, NOW WHAT?
President Biden needs to immediately reverse his ban on the Keystone XL pipeline project from Canada and reverse restrictions on oil and gas drilling in the U.S., in order to unleash increased production and bring down spiking oil, gas and gasoline prices that triggered, and are contributing to, the inflation spike.
Inflation is out of control and stagflation is biting its heels...threatening national security!
This is not a problem that can be solely rectified by the Federal Reserve.
Biden's administration owns this and it is incumbent on President Biden to restore economic and national security stability to the United States...without further delay.
Wake up, America!
~~~~~~~
FALLS INTO
THE MOUTH
OF A
SLEEPING LION.
~~~~~~~