WELCOME

Welcome and thank you for visiting!

The charts, graphs and comments in my Trading Blog represent my technical analysis and observations of a variety of world markets...
* Major World Market Indices * Futures Markets * U.S. Sectors and ETFs * Commodities * U.S. Bonds * Forex

N.B.
* The content in my articles is time-sensitive. Each one shows the date and time (New York ET) that I publish them. By the time you read them, market conditions may be quite different than that which is described in my posts, and upon which my analyses are based at that time.
* My posts are also re-published by several other websites and I have no control as to when their editors do so, or for the accuracy in their editing and reproduction of my content.
* In answer to this often-asked question, please be advised that I do not post articles from other writers on my site.
* From time to time, I will add updated market information and charts to some of my articles, so it's worth checking back here occasionally for the latest analyses.

DISCLAIMER: All the information contained within my posts are my opinions only and none of it may be construed as financial or trading advice...please read my full Disclaimer at this link.

Dots

* If the dots don't connect, gather more dots until they do...or, just follow the $$$...

Loyalty

Loyalty

ECONOMIC EVENTS

 UPCOMING (MAJOR) U.S. ECONOMIC EVENTS...

***2024***
* Fri. April 5 @ 8:30 am ET - Employment Data
* Wed. April 10 @ 2:00 pm ET - FOMC Meeting Minutes
* Wed. April 17 @ 2:00 pm ET - Beige Book Report
* Wed. May 1 @ 2:00 pm ET - FOMC Rate Announcement + Forecasts and @ 2:30 pm ET - Fed Chair Press Conference

*** CLICK HERE for link to Economic Calendars for all upcoming events.

Thursday, February 24, 2022

WTI CRUDE OIL: Little Price Resistance Above 100.00...Retest Of 147.27 Is Possible

I last wrote about WTI Crude Oil in my post of September 12, 2021.

I identified price targets of 80.00 and 100.00, provided it broke and held above 70.00.

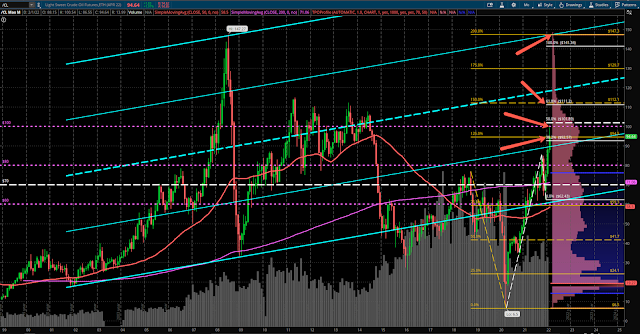
Following Russia's declaration of war and invasion last night of UkraineOil hit 100.54 today, before falling back to close at 94.75...which is around a convergence point (lower red arrow) of a 40% Fibonacci Extension level with a 125% External Quadrant level, and is just above the bottom 1/4 of a long-term rising channel, as shown on the following monthly chart.

There is little price resistance above 100.00, as shown on the pink TPO Profile along the right-hand side of the chart.

Price targets are identified by the other three red arrows, which are also convergence points on the Fibonacci Extension with the External Quadrant. The highest red arrow also happens to converge with the upper 1/4 of the rising channel.

If price can remain above 90.00, it has a good chance of continuing its rally to these three targets, namely, 100.00, then 111.00-112.00, and then, ultimately, retesting its prior all-time high of 147.27.

Otherwise, a drop and hold below 90.00 could see a retest of 80.00, then 70.00, or lower.

At the moment, the "path of least resistance" is up.