* See UPDATE below...
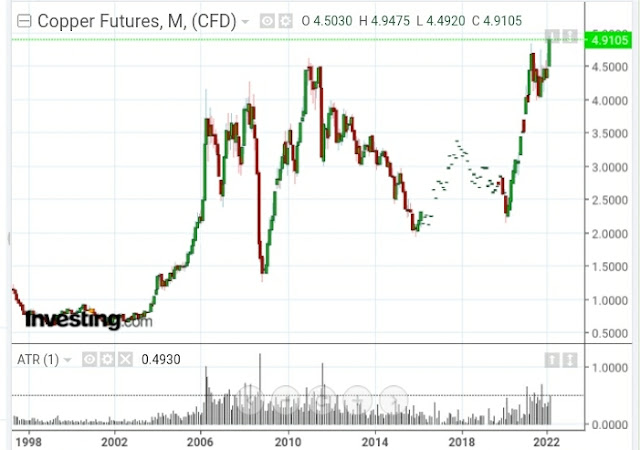
The last time that Copper's (HG) Average True Range of each month remained elevated at extreme levels for an extended period of time (from mid-2006 to April 2008), it eventually lost over 50% of its value, as shown on the following monthly chart.
The ATR is shown in histogram format with an input value of one period, to illustrate prior reversal points on extreme ATR spikes, or points at which price stalled, then consolidated.
It's been consolidating inside a large range between 4.00 and 4.90 since March 2021, following an extreme spike the month before, and the ATR has been generally declining since then...a sign that price is coiling in preparation for a breakout one way or the other.
Failure to break and hold above 4.90 on steadily increasing ATR spikes could see it plummet below 4.00 to around 3.00, or even 2.50.
So, we may see an extreme ATR spike form, if price retests or overshoots 4.90 to, possibly, signal the next reversal point to send it down to one, or all, of the above targets...one clue worth monitoring over the coming months.
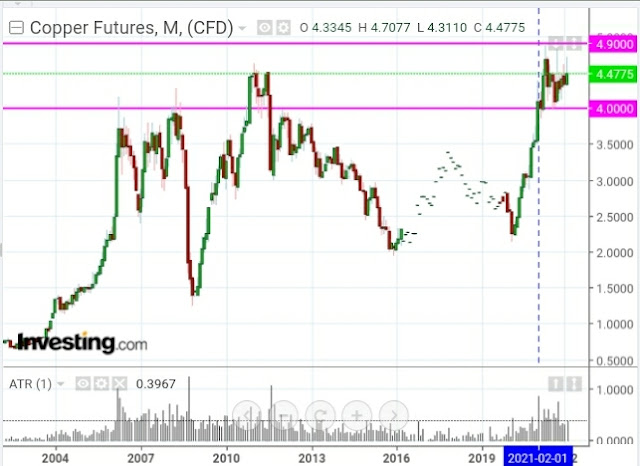
In conclusion, I'd say that Dr. Copper may be tired and becoming anemic...and may be ready to look for lower ground on which to sleep for awhile...particularly, since it's doubtful that the global supply chain issue is going to be resolved any time soon, and the Fed may end up aggressively raising interest rates faster than market makers may think, to curb out-of-control inflation and spiking oil prices.
* UPDATE March 4...
Copper spiked above 4.90 mid-day and is holding, so far, as at 2:20 pm ET.
There is no extreme spike, yet, on the monthly ATR (for March), as shown on the chart below...although, it's been rising since February.
If price pushes higher, keep an eye on the ATR over the coming days and weeks, to see whether it has formed an extreme spike by the end of March...to, potentially, signal that a sharp reversal may, then, be forthcoming.