Thank you to the following sites for hosting my articles this year:
Best wishes for a very Happy New Year 2022 and may it bring good health, peace and prosperity! 😊

Thank you to the following sites for hosting my articles this year:
Best wishes for a very Happy New Year 2022 and may it bring good health, peace and prosperity! 😊
* See UPDATE below...
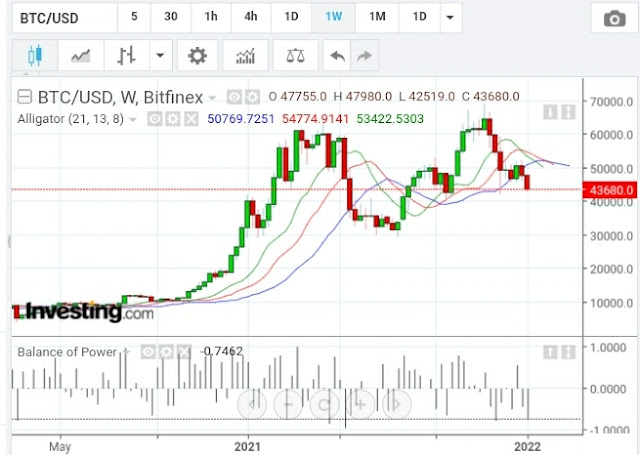
How much longer until Bitcoin (BTC/USD) catches up to SPCE and hits 20,000, or lower?
It's been lagging SPCE since June...and judging by the price action on the following weekly comparison chart, it may be sooner rather than later.
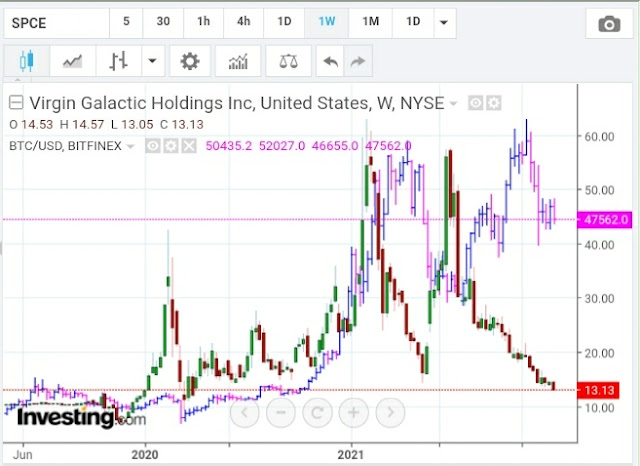
* UPDATE January 5...
20,000 still possible...or lower (plus see my 2021 Market Wrap-Up and 2022 Forecast here for context)...
When all you've received for Christmas is the box, Boxing Day takes on a whole new meaning this year...😏

2022 can't come soon enough! 🎉
When will President Biden begin to discern and disseminate fact over fiction?

But, he's not fooling anyone. Luckily, Americans are smart enough to know this and will remember at the voting booths in 2022 and 2024.


* See UPDATE below...
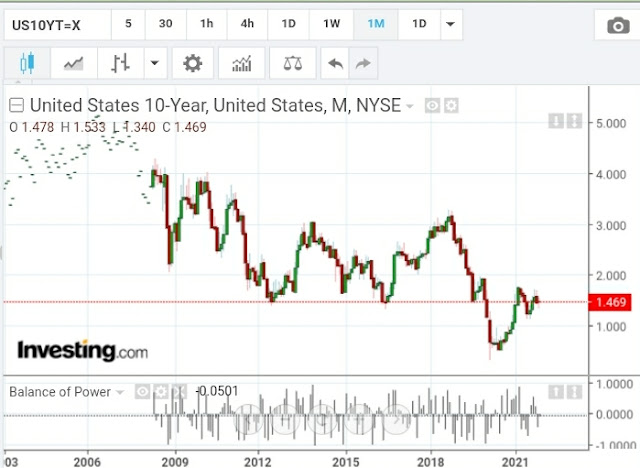
US10YT is sitting at a major price crossroads level, as shown on the following monthly chart.
The tightening triangle formation on the Balance of Power, shown in histogram format, is indicating that price will break out of its current tight consolidation at some point in the near future.
Keep an eye on the BOP for clues on direction, strength and sustainability of such a breakout.
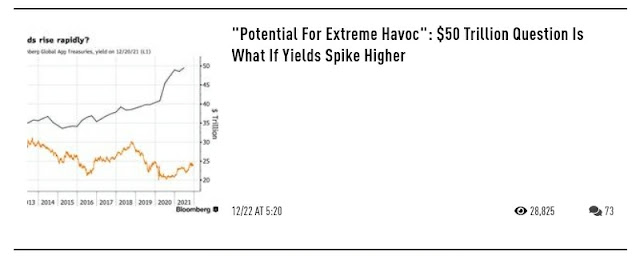
* UPDATE December 22...
What if...
* See UPDATE below...
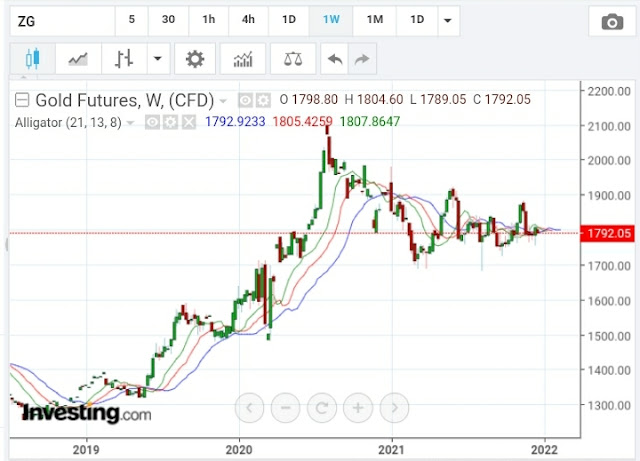
GOLD is poised for a breakout and a retest of 2,000, or higher, as shown on the following monthly chart.
Major resistance is around 1,850 and major support around 1,750.
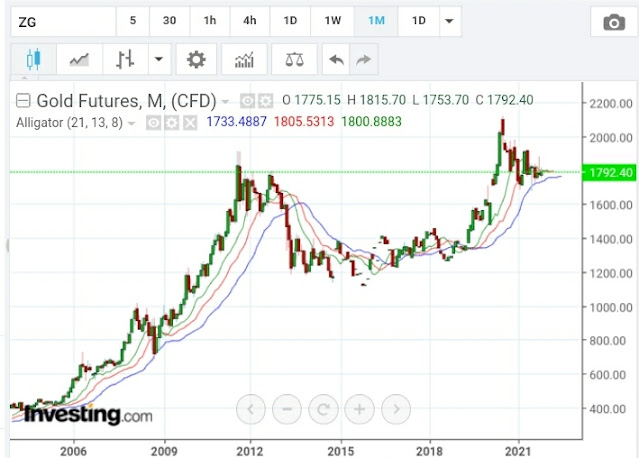
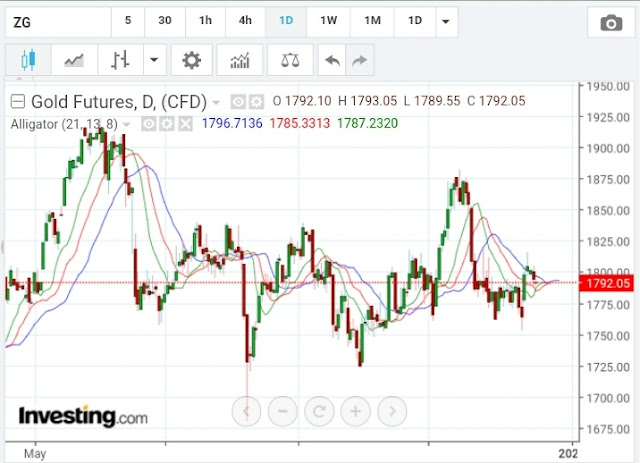
The William's Alligator is flat on the daily and weekly charts, so watch for a curl and hold up or down in the days and weeks ahead to, first forecast, then confirm, a breakout in either direction.
* UPDATE December 28...
Another perspective on GOLD's prospects...

The Technology sector may be in for a bit of a bounce here, IF major support holds on FNGU -- an exchange-traded note that tracks 3x the daily price movements on an index of US-listed technology and consumer discretionary companies -- around the 32.00 level (price support plus the upper moving average on the William's Alligator on the monthly timeframe).
Check out the daily, weekly and monthly charts below.


However, any sustainable rally must break and hold above the trendline on the weekly chart around 33.00.
Otherwise, look for further weakness to continue.

* See UPDATES below...
I recently wrote about the SPX and SPX:VIX ratio here.
In it, I mentioned that, "Volatility is rising and is fraught with large-scale whipsaw action...expect this to continue for the near future."
Take a look at the following graphic.
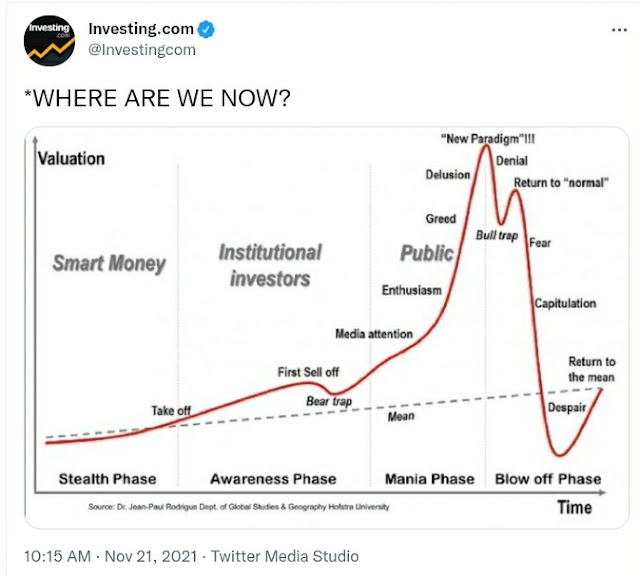
Now compare it to the following monthly chart of the SPX.
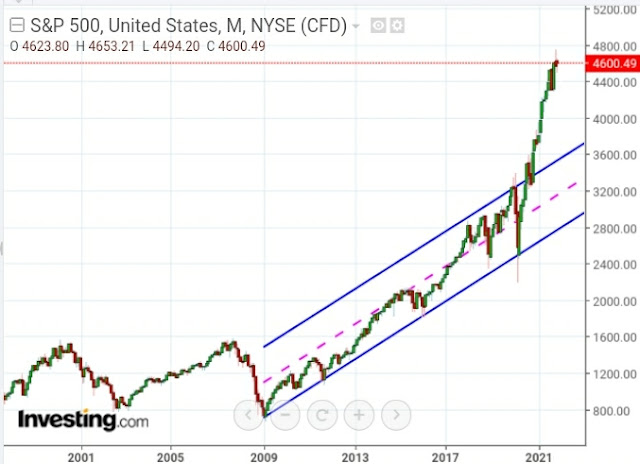
I don't think anyone could be faulted if they labelled the SPX as being in the beginning of the "Blowoff Phase" (noted on the graphic) at or near the top of this extremely overextended long-term bull run...with "Public Money" most at risk.
The price has spiked far above the channel "mean" since it last touched it in May of 2020, and it will return at some point.
If so, and, as inflation continues to rise, look for volatility to continue into 2022 and watch for the "Smart Money" and "Institutional Investors" to divest themselves of high-risk assets (growth sectors), take profits, and hold cash for awhile, before rotating back into value sectors.
Perhaps Elon Musk had similar ideas when he sold some of his TSLA shares recently.
This link to Insiders Buying and Selling may provide such insight...as well as this link.
BUT, don't just take my word for it...someone else is predicting a blow-off to levels much lower than anticipated (article below)..."yowza" indeed.
And, as noted on the monthly chart above, the SPX channel "mean" is around 3200 at the moment, so a reversion to that level would wipe out gains from the past year and a half...who's prepared for that!

* UPDATE December 10...
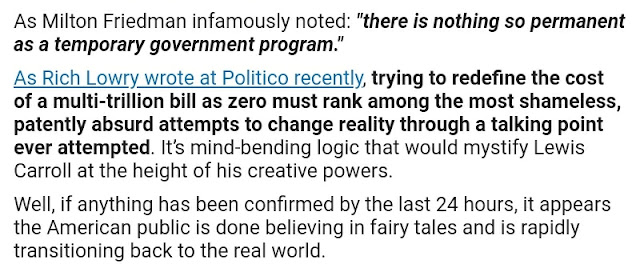
The true cost of Biden's "Build Back Better" bill is exposed: it's "...shameless...patently absurd...mind bending logic..." to say that it's free.
And, with inflation running at 40-year highs (CPI = 8% m/m and 6.8% YoY...real inflation is up around 15% this year over last year), passage of this bill would cripple low and middle-income American taxpayers for a very long time.


It would be reckless for market participants and taxpayers not to take these facts into consideration over the coming months.
* UPDATE December 11...
Are insiders engaging in ponzi schemes? As I mentioned above, keep an eye on their sales.


* UPDATE December 12...
Is this legal???


* UPDATE December 13...
And...there's more...

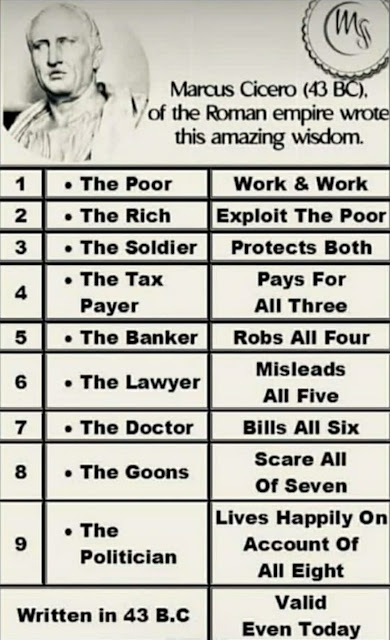
Some things haven't changed since 43 BC 😕...

Is anyone surprised?...

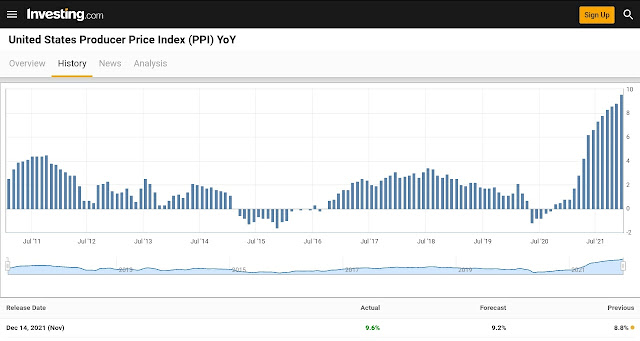
* UPDATE December 14...
Wait...there's more (inflation...PPI YoY = 9.6%)...and it will get worse...


* UPDATE January 9...
Is anyone surprised by this headline?

...Or does it?
After its meteoric Black Friday plunge, the SPX gapped up on today's open, rallied a bit and has been basing for a couple of hours (as at 2:15 pm).
The catalyst for this purge was news of the new Omicron COVID-19 variant from the southern African countries.

This two-day SPX price action is shown on the following daily chart.
Friday's close landed on the lower moving average (21 MA offset into the future) of the William's Alligator formation. The upper moving average (8 MA offset into the future) has crossed below the middle one (13 MA offset into the future), hinting of further weakness and rising volatility. The Balance of Power indicator failed to make a new high on the last two SPX swing highs, warning of weakening buying.
Watch for the 8 MA to cross below the 21 MA to signal a further pullback may be forthcoming. A cross of the 13 MA below the 21 MA could very signal a larger correction is imminent...particularly if the price drops and holds below 4600.

The RSI indicator on the following SPX:VIX daily ratio chart failed to make a new swing high when the ratio made its last swing high on November 2, and continued to decline, hinting of weakness ahead for the SPX. Similarly, neither the MACD nor the PMO indicators made new swing highs, and they crossed over into bear territory shortly thereafter.
A drop and hold below 200 could see ratio price retest 150, or even 100, or lower, depending on the velocity of a further pullback on the SPX.
In this regard, keep an eye on the Rate of Change indicator on the SPX (I've shown it with an input value of 1 period)...inasmuch as a drop and hold below the zero level will indicate increasing velocity to the downside and to what degree each day.

So, with the discovery of yet another variant, can anyone blame the scepticism displayed in the second tweet...especially when a prior tweet contains information that may be erroneous and premature? Both tweets were posted early Friday.
Trade with caution, inasmuch as the markets are prone to over and under-react to news, especially regarding COVID-19.

* UPDATE November 30...
Another day...another turnaround in markets to the downside...thanks to more public speculation on the latest COVID variant and Fed Chair Jerome Powell's remarks this morning while testifying before the Senate Banking Committee regarding "transitory" inflation..."time to retire that word."
His subsequent remarks regarding "wrapping up the taper of our asset purchases...sooner" added fuel to the fire.
At 12:10 pm ET, the SPX broke below Friday's low and hit a low of 4565...we'll see where it closes today.


Volatility is rising and is fraught with large-scale whipsaw action...expect this to continue for the near future.
The next Fed meeting is December 15...we'll see what happens.
* UPDATE December 1...
Another day...another (very big) plunge...

If the SPX:VIX ratio remains below 150, watch for this SPX pullback to continue...especially since all MAs have now formed a bearish crossover on the William's Alligator.