WELCOME

Welcome and thank you for visiting!

The charts, graphs and comments in my Trading Blog represent my technical analysis and observations of a variety of world markets...
* Major World Market Indices * Futures Markets * U.S. Sectors and ETFs * Commodities * U.S. Bonds * Forex

N.B.
* The content in my articles is time-sensitive. Each one shows the date and time (New York ET) that I publish them. By the time you read them, market conditions may be quite different than that which is described in my posts, and upon which my analyses are based at that time.
* My posts are also re-published by several other websites and I have no control as to when their editors do so, or for the accuracy in their editing and reproduction of my content.
* In answer to this often-asked question, please be advised that I do not post articles from other writers on my site.
* From time to time, I will add updated market information and charts to some of my articles, so it's worth checking back here occasionally for the latest analyses.

DISCLAIMER: All the information contained within my posts are my opinions only and none of it may be construed as financial or trading advice...please read my full Disclaimer at this link.

Dots

* If the dots don't connect, gather more dots until they do...or, just follow the $$$...

Loyalty

Loyalty

ECONOMIC EVENTS

 UPCOMING (MAJOR) U.S. ECONOMIC EVENTS...

***2024***
* Fri. April 5 @ 8:30 am ET - Employment Data
* Wed. April 10 @ 2:00 pm ET - FOMC Meeting Minutes
* Wed. April 17 @ 2:00 pm ET - Beige Book Report
* Wed. May 1 @ 2:00 pm ET - FOMC Rate Announcement + Forecasts and @ 2:30 pm ET - Fed Chair Press Conference

*** CLICK HERE for link to Economic Calendars for all upcoming events.

Sunday, January 23, 2022

ARKK: Bears Still In Control

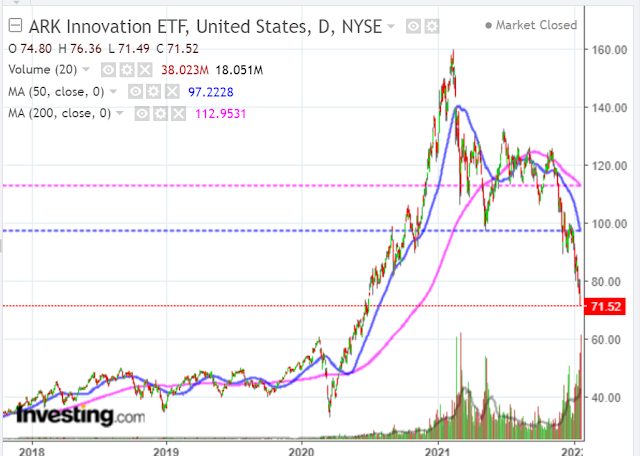
An inverted cup and handle began to form in November of 2020 on ARK Innovation ETF (ARKK), as shown on the following daily chart.

A bearish moving average Death Cross formed on June 30, 2021 and never reversed after that date.

The bears are still firmly in control of this ETF.

As of last Friday, price is sitting just above the 50-month MA (70.696) and just below the 200-week MA (73.404).

A break and hold below 70.00 could send it down to 40.00, or lower to its IPO price around 20.00.