
The Weekly charts below of YM, ES, NQ & TF show that all four closed higher than last week's high...in fact, this week's candle on the ES, NQ & TF are "outside" bullish candles with closes very near their high...highly bullish setup. The ES closed right at the lower uptrending channel and the NQ closed above its upper channel...we'll see whether the ES can re-enter and stay within the channel to continue a rally...I'd be looking for the ES to hold above this week's high of 1403 in this regard. Otherwise, a failure at this level could send the ES down to the middle Bollinger Band at 1338.

As I mentioned in my market update of April 13th, I'm assigning a weekly bullish or bearish rating on YM, ES, NQ & TF until the end of this year. Please refer to that post for the parameters, and to the Weekly charts below. As of this past week's close, the ratings for next week are as follows:
- YM = mildly bullish
- ES = mildly bearish
- NQ = bullish
- TF = mildly bullish

As shown on the 4-Hour charts below of YM, ES, NQ & TF, the NQ and TF broke above their downtrending channel and have formed a new uptrending one. The ES closed just below its current uptrending channel on this timeframe. All four have retraced more than 61.8% of their dip from their March high...an impressive run, so far. A drop and hold below each of their respective channels would weaken an argument for further upside potential in the short term.

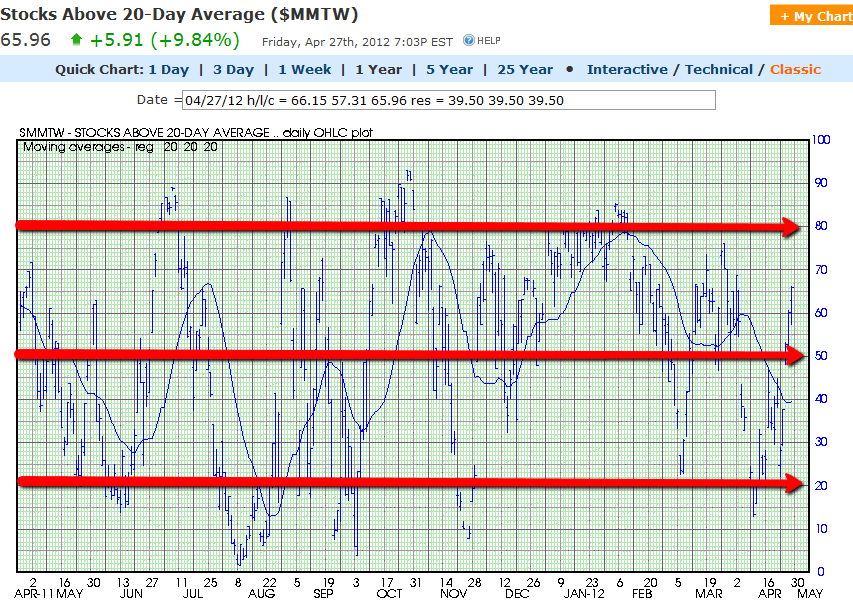
The three Daily charts below depict support and resistance levels on the percentage of Stocks Above 20-Day, 50-Day, and 200-Day Averages.
Stocks Above 20-Day Average closed higher than last week to just below the 66% level.
Stocks Above 50-Day Average closed higher than last week to just above the 55% level.

Stocks Above 200-Day Average closed higher than last week to just above the 70% level.

I'd conclude that, in the short term stocks are moderately bullish, in the medium term stocks are mildly bullish, and in the longer term stocks are bullish...but, as has been the case for the past five weeks, all are still on negative watch for further potential weakness until they re-test and hold above their new support levels of 60%, 50%, and 65%, respectively.
The VIX dropped on the week (by 13.97%), as shown on the graph below.

Further to the comments in my last weekly market update, the Daily ratio chart below of the SPX:VIX shows that that the SPX bounced and closed above its 50 sma. The RSI, MACD, and Stochastics indicators are trending up...however, the Stochastics is a bit overbought. Near-term support is at, firstly, 85.00, then the 50 sma of 81.55...short-term resistance is at 90.00...important levels to watch.

As shown on the graph below of the Industry Groups, Retail was the big gainer, with gains made in all others. Whether consumers can continue to "carry the can" in boosting the GDP numbers for the next quarter(s) of this year remains to be seen, particularly with declining incomes, as noted in my post of March 1st.

As shown on the graph below of the Major Sectors, the largest gains were made in Consumer Discretionary, with gains made in all others...the smallest gains were made in the defensive sectors, so, the appetite for the risk trade grew this past week, with the presumption of a continuation next week...perhaps Monday's Personal Income and Outlays data and market reaction will set the tone for direction.

As shown on the graph below, the biggest gains were made in the European Financials ETF (EUFN), followed by the U.S. Financials ETF (XLF), the Emerging Markets ETF (EEM), the Chinese Financials ETF (GXC), and the Commodities ETF (DBC). The Agricultural ETF (DBA) was flat again this week.

As shown on the graph below, the largest gains were made in Copper, followed by Gold, Oil, and Silver.

The following four Weekly charts of Gold, Oil, Copper, and Silver show support and resistance levels...ones to watch, particularly Gold and Copper.


As shown on the graph below of the Major Indices, they all gained, with the Russell 2000 gaining the most. Gains were made in the High Dividend-Paying Stocks ETF (DVY), EEM, and Corporate Bonds (JNK).

As shown on the currency graph below, money flowed into the Aussie $, Canadian $, British Pound, and Euro...and out of the U.S. $.

The Daily ratio chart below of the SPX:U.S. $ shows that the SPX strengthened in comparison to the $ and now sits just below major resistance at 18.00. The RSI, MACD, and Stochastics are trending up, but the Stochastics is in overbought territory. Near-term support sits at the 50 sma at 17.43...ones to watch to see if the $ continues to weaken against the SPX.

In summary, continued upside moves this coming week, regardless of positive or negative data releases, will confirm increased risk buying, which could send the YM, ES, NQ & TF to new highs for this year...which is quite possible in advance of the multiple Employment data releases due on Friday.
Enjoy your weekend!