WELCOME

Welcome and thank you for visiting!

The charts, graphs and comments in my Trading Blog represent my technical analysis and observations of a variety of world markets...
* Major World Market Indices * Futures Markets * U.S. Sectors and ETFs * Commodities * U.S. Bonds * Forex

N.B.
* The content in my articles is time-sensitive. Each one shows the date and time (New York ET) that I publish them. By the time you read them, market conditions may be quite different than that which is described in my posts, and upon which my analyses are based at that time.
* My posts are also re-published by several other websites and I have no control as to when their editors do so, or for the accuracy in their editing and reproduction of my content.
* In answer to this often-asked question, please be advised that I do not post articles from other writers on my site.
* From time to time, I will add updated market information and charts to some of my articles, so it's worth checking back here occasionally for the latest analyses.

DISCLAIMER: All the information contained within my posts are my opinions only and none of it may be construed as financial or trading advice...please read my full Disclaimer at this link.

Dots

* If the dots don't connect, gather more dots until they do...or, just follow the $$$...

Cat Latte

Cat Latte

ECONOMIC EVENTS

UPCOMING (MAJOR) U.S. ECONOMIC EVENTS...

***2026***
* Wed. Oct. 28 @ 2:00 pm ET - FOMC Rate Announcement and @ 2:30 pm ET - Fed Chair Press Conference

*** CLICK HERE for link to Economic Calendars for all upcoming events.

Wednesday, November 09, 2011

It rained on the markets today...hard...


The Daily charts below of the YM, ES, NQ & TF show that price closed down hard on high volumes and below the middle Bollinger Band today. The YM, ES & TF have been turned back by the 200 sma (pink) several times now, while the NQ is still being supported by its 200 sma. Price has yet to confirm an uptrend on this timeframe above immediate support, it is still under the influence of the Death Cross formation that I mentioned in my last post, and it is still subject to a resumption of further bearish downside movement until the positioning of the 50 & 200 smas are reversed with conviction. Also, with the VIX back above 35.50, it's likely we'll see further large and volatile moves while it remains above 25.00, as shown on the 4-hourly chart below.


Below is a chartgrid of the YM, ES, NQ & TF...each candle represents a one-month Options Expiry period. If history repeats itself, they could be readying themselves for a fall, similar to that in mid-2008 as indicated by the arrows. I'll be watching to see where the current candle closes on November 18th (OPEX) and where price goes from there.


I've written a number of posts over the past months on Japan's Nikkei Futures Index, NKD.  It has tended to trade roughly similarly to the 4 e-mini futures indices mentioned above since the earthquake in March this year. It also closed down hard today on high volumes and has closed below a rising channel for the second time, as well as its 50 sma (red), as shown on the Daily chart below. It did not rise as strongly from the beginning of October, and is considerably weaker than its American counterparts...one to watch, particularly it it breaks and holds below its next level of support at 8200.


The Opt. Exp. period chart below of the NKD shows where price may be relative to mid-2008...price has been sold off every time it tried to climb back above 10000 last year and this year. Again, we'll see where the current candle closes on OPEX November 18th.


Monday, November 07, 2011

Financial Markets are Clinging...

I've mentioned a number of times recently that it's my opinion that the equities markets will need the Financial markets on board in order to resume a meaningful and convincing advance...at the moment, they (Financials) are grappling with the middle of the Bollinger Bands on their Daily charts, after bouncing at the beginning of October.

As can be seen on the first Daily chartgrid below, the Financials ETF, XLF, is moderately stronger than the individual bank stocks (which are all just above their 50 sma (red), except for BAC)...they are all a considerable distance below their 200 sma (pink), in contrast to the YM, ES, NQ & TF which are much stronger, as shown on the second Daily chartgrid below (the action on those is currently taking place either above or below their 200 sma).

It should be noted, however, that all these charts are still under the influence of a Death Cross (with the 50 sma below the 200 sma), and price is subject to a resumption of further bearish downside movement until the positioning of these moving averages is reversed with conviction.


Should the 4 e-mini futures indices continue to advance, we will need to see the Financials continue to advance, as well. The percentage comparison chart below of the Dow 30, S&P 500, Nasdaq 100, Russell 2000, and XLF shows that XLF has outpaced the Dow, S&P and Nasdaq since its October 4th lows in terms of percentage gained from that date.


The percentage comparison chart below of XLF, GS, JPM, C, BAC, & MS shows that BAC has begun to show relative weakness since November 4th (as confirmed on the Daily chartgrid above) and is one to watch over the coming days/weeks...to either play "catch up," or potentially signal a reversal in the Financials, and possibly the equities markets.


Will the Nasdaq 100 match what people are planning to buy for Xmas?

According to www.Infographiclist.com, 38% of people have already started their holiday shopping:
http://infographiclist.com/2011/11/07/it-is-the-season-to-be-shopping-infographic/


If 75% are planning to buy electronics, and with 49% planning to spending the same as they did in 2010, we'll see whether the NQ continues to outpace the YM, ES & TF in terms of overall strength until Xmas.

At the moment, all 4 are being held back by their 50 sma (red) on the 4-hour chart, but are still trading above their 200 sma (pink)...price may bounce around in between those moving averages as long as there are more unsettling rumours coming out of Europe (perhaps until we get closer to Black Friday). The TF is leading today's weakness along with a small pullback in EUR/USD.

Saturday, November 05, 2011

European Financials ETF...EUFN

Further to my posts since November 3rd, I'm adding the European Financials ETF, EUFN, to my watchlist for clues on the health of Europe's banks...below are a series of charts depicting price action relative to an upward-sloping channel that it's been in since its September lows. Contrary to the YM, ES, NQ & TF, it is trading below its middle Bollinger Band on all timeframes and is just above the botom of its channel after failing to hold above resistance at 17.50...furthermore, a descending triangle could be forming on the Monthly and Options Expiry timeframes, which would signal a bearish continuation...it's not looking too healthy at the moment...will see where it goes from here.


Canadian Banks Smelling Trouble?

An interesting read from Greg Schnell at www.StockCharts.com concerning weakness in the Canadian banks...potentially signalling more trouble in Europe (Italy)...definitely stocks I'll be watching in the days/weeks ahead...his blog post is worth reading:

http://blogs.stockcharts.com/canada/2011/11/lets-review-the-canadian-banks.html

If you want to save their charts, just left click on each chart and then left click on "Linkable Version" at the bottom of the chart...then click on "File" at the top of your browser window and send a copy to your desktop to save...each chart will then update each day when you click on it so you can follow the progress and see how this story unfolds.

Friday, November 04, 2011

YM, ES, NQ & TF on the "Positive" Side...

Below are a series of chartgrids of the YM, ES, NQ & TF in a variety of timeframes...very simply, price is trading on the "positive" side of the mid-point of the Bollinger Bands on all timeframes. A cross and hold below could send these e-mini futures back down to their respective lower Bollinger Bands. Otherwise, I'll look for price to rally upwards to their respective upper Bollinger Bands.


Below are Daily charts of Copper, DBC (Commodities ETF), and AUD/USD forex pair. Each one is trading around either their 50 sma (red) or 200 sma (pink)...since these moving averages are also of importance to the YM, ES, NQ & TF at the moment (acting as either support or resistance), I'll also be watching these three for corresponding moves to the equities markets in the days/weeks ahead...for any developing weakness or strength in any of them...and whether volumes build on any further advancement to signal possible institutional commitment, or whether volumes taper off.


List of 29 Banks Deemed Too Big to Fail...

The Financial Stability Board of the G20 has published its list of 29 banks that have been deemed too big to fail...they are:

U.S.: Bank of America, Bank of New York Mellon , Citigroup, Goldman Sachs, J.P. Morgan, Morgan Stanley, State Street, Wells Fargo

U.K.: Royal Bank of Scotland PLC, Lloyds Banking Group PLC , Barclays PLC , HSBC Holdings PLC

France: Credit Agricole SA , BNP Paribas SA , Banque Populaire, Societe Generale SA

Germany: Deutsche Bank AG , Commerzbank AG

Italy: Unicredit Group SA

Switzerland: UBS AG , Credit Suisse AG

Belgium: Dexia SA

Netherlands: ING Groep NV

Spain: Banco Santander SA

Sweden: Nordea AB

Japan: Mitsubishi UFJ FG , Mizuho FG, Sumitomo Mitsui FG

China: Bank of China

MarketWatch has further details on this at this link: 


Marketing "Traps"...


The EU Debt Crisis in Charts

Courtesy of www.Infographiclist.com

Click this link to see enlarged version:
http://infographiclist.com/2011/10/07/the-eu-debt-crisis-in-charts-infographic/


Thursday, November 03, 2011

Head & Shoulders vs. Double Top

The case in favour of the Major Indices forming a H&S pattern on their Daily charts appears to be fading, with the Dow 30 and the Russell 2000 putting in a much higher right shoulder on today's action...there is still a chance for such a formation to play out on the S&P 500 and the Nasdaq 100...please refer to the Daily charts below. The Dow 30 is just shy of the next resistance levels at 12100 & 12200, while the other three closed at resistance levels.


The Financials ETF, XLF, closed today in between resistance and support and has put in a slightly higher right shoulder on a potential H&S formation, as shown on the Daily chart below.


Everybody's favourite, EUR/USD, is also in the process of forming a H&S pattern...price closed just below the falling 50 sma, price resistance, and the slightly lower right shoulder, as shown on the Daily chart below.


Since each of the above instruments has rallied since the beginning of October, I've brought in the following percentage comparison Daily chart to compare their relative strength. The potential H&S pattern can be seen beginning from October 21st. It also shows that the EUR/USD has been weakening and lagging in the rally since October 10th. I'll be watching for signs of a decline beginning in the EUR/USD and whether the others weaken and follow suit over the next few days/weeks. Whether these markets decline from a H&S pattern, or possibly from a double top remains to be seen.


In addition and for comparison purposes, I'll be watching the VIX, DB, Gold, DBC, $CRX, AUD/USD, the Australian Stock Index ($AORD), the Portuguese Stock Index ($PSI), the US $ (/DX), and NKD as referenced in my prior posts from October 25th onwards.

Gold's Relationship to $SPX

With all the contradicting rumours recently regarding Europe, it may be worth watching the relationship of price action on Gold versus the S&P 500 Index ($SPX)...to see which one may be acting as actual bullish buying versus hedging on a potential bearish downturn.

Below are Daily charts of Dec/11 Gold and $SPX.

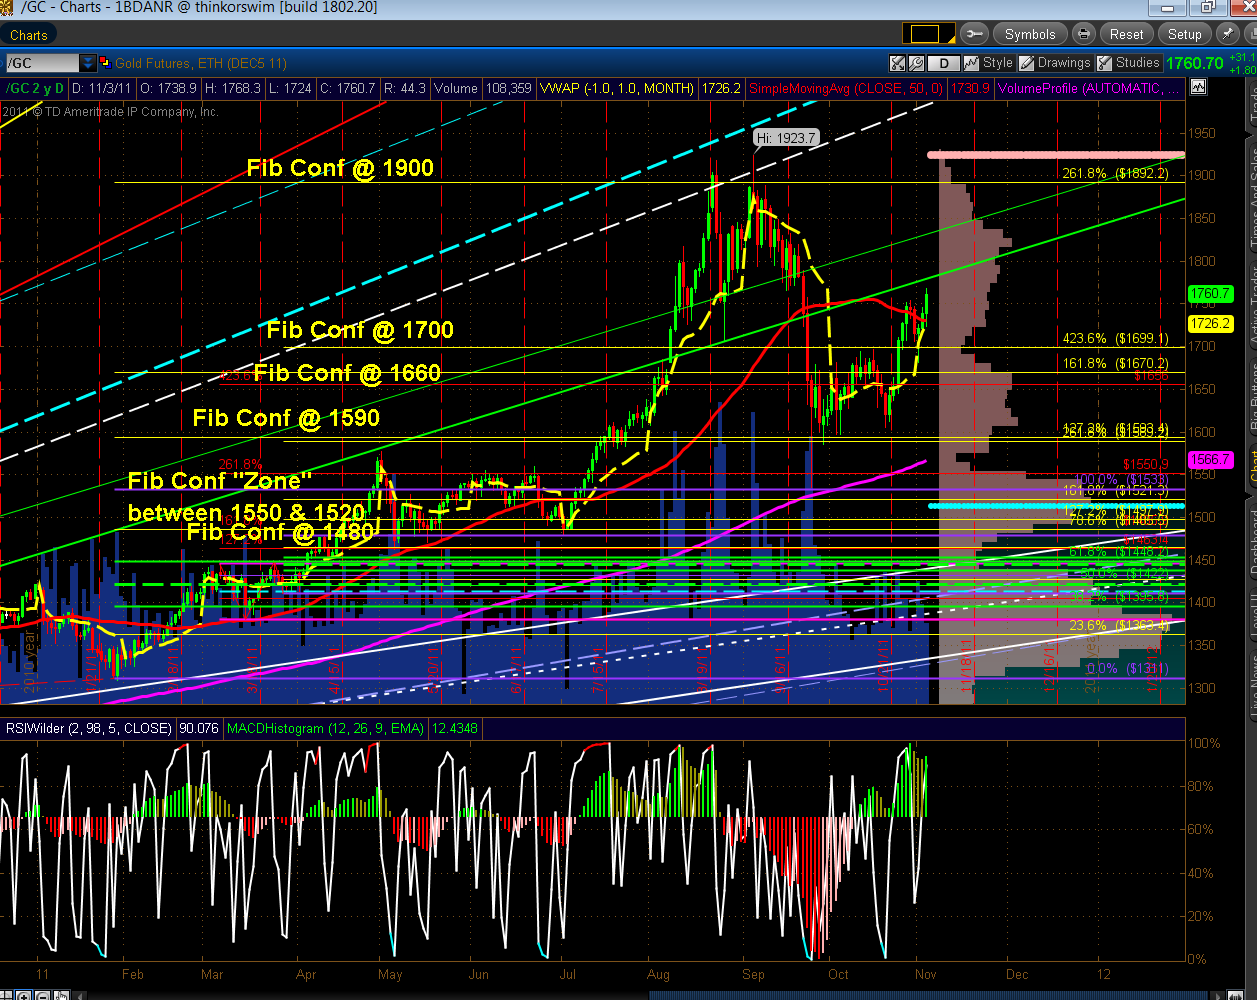
Gold has been quietly rising after finding support around 1600 and has broken above its last swing high...above are a couple of Fibonacci fan line resistance levels around 1775 and 1830, so it has room for further upside movement.

$SPX has run into a confluence of price and Fibonacci fan line resistance and, as I mentioned in last night's post, may be forming the right shoulder of a H&S pattern.


Below is a 20-day 30-minute percentage comparison chart of Dec/11 Gold and $SPX. Up until today, the $SPX has led the advance in percentage terms...but Gold is not far behind as of today's writing...I'll be watching for any sign of a cross-over in the next few days as traders potentially lose confidence in equities.


With all the temper tantrums being thrown in Europe, fund managers may find that Gold is the safest place to park their money for the next while...another relationship that I'll be watching over the next days/weeks to come.

Wednesday, November 02, 2011

Big Brother's "protection"

After listening to Ben Bernanke's press conference today, it is my opinion that as long as the Fed (Big Brother) stands ready to add more stimulus if "conditions warrant" (as they've repeatedly said), the markets (banks) will continue to add risk and accumulate shares in equities and commodities...barring, or course, any further "financial crisis rumours" from Europe, which could temporarily disrupt such market mandate.

I noticed that Mr. Bernanke failed to speak of any increased debt that consumers and businesses may have added in their recent spending increases and by what percentage their debt loads have increased as a result...obviously this would have negatively impacted such dovish news and may have been left out deliberately...however, I'll give him the benefit of the doubt and assume that he simply forgot to mention this.

As for his statement that individuals can make more by investing their money in the markets than by saving, I would ask him for a show of hands of all people in the United States who actually have savings left over after paying their monthly expenses and credit debts...perhaps he's assuming that those with a bit of extra money will, in desperation, risk their savings and entrust them into the hands of brokers/bankers to magically produce an endless supply of investment income...after all, if brokers/bankers are going to be protected with the elixir of future stimulus, why not?

So, in keeping with this positive assumption, I wold look for the YM, ES, NQ & TF to embrace and confirm that view by making a higher swing high on their Daily charts (see chartgrid below), while not violating their lows made on November 1st...this would re-enforce the establishment of a new uptrend from the October lows. Otherwise, if the November 1st lows are broken, this would call into question the market's ability to advance at the current levels...it also calls into question the markets' belief in what Mr. Bernanke has said. We can see a H&S formation developing from October 24th, with the neckline around the November 1st lows...should this be broken and held with conviction, then the equity markets will fall back into their large trading range below.


N.B. In a perfect world, that is what the above dovish scenario represents...do your own due diligence before leaping in with both feet.

Tuesday, November 01, 2011

What's the purpose of life?


Are the markets retracing an uptrend, or are they rallying on a downtrend (are we in bull or bear market)? Is Greece going to hold a referendum or not? Will Europe ever get its fiscal, economic, and financial houses in order? Who is manipulating the markets with rumours regarding Europe? Will the U.S. politicians ever agree on anything before next year's election is over? Will Obama make the rich pay higher taxes? Will the Fed play Santa Clause this year and give the markets QE3? Are there more "MF Global situations" just around the corner waiting to blow up?  Can we trust reported accounting numbers from other banks/brokerages? Where are the FDIC and SEC hiding in all of this? Will these questions ever be answered? I could go on and on, but it all seems so futile and they're rhetorical anyway...

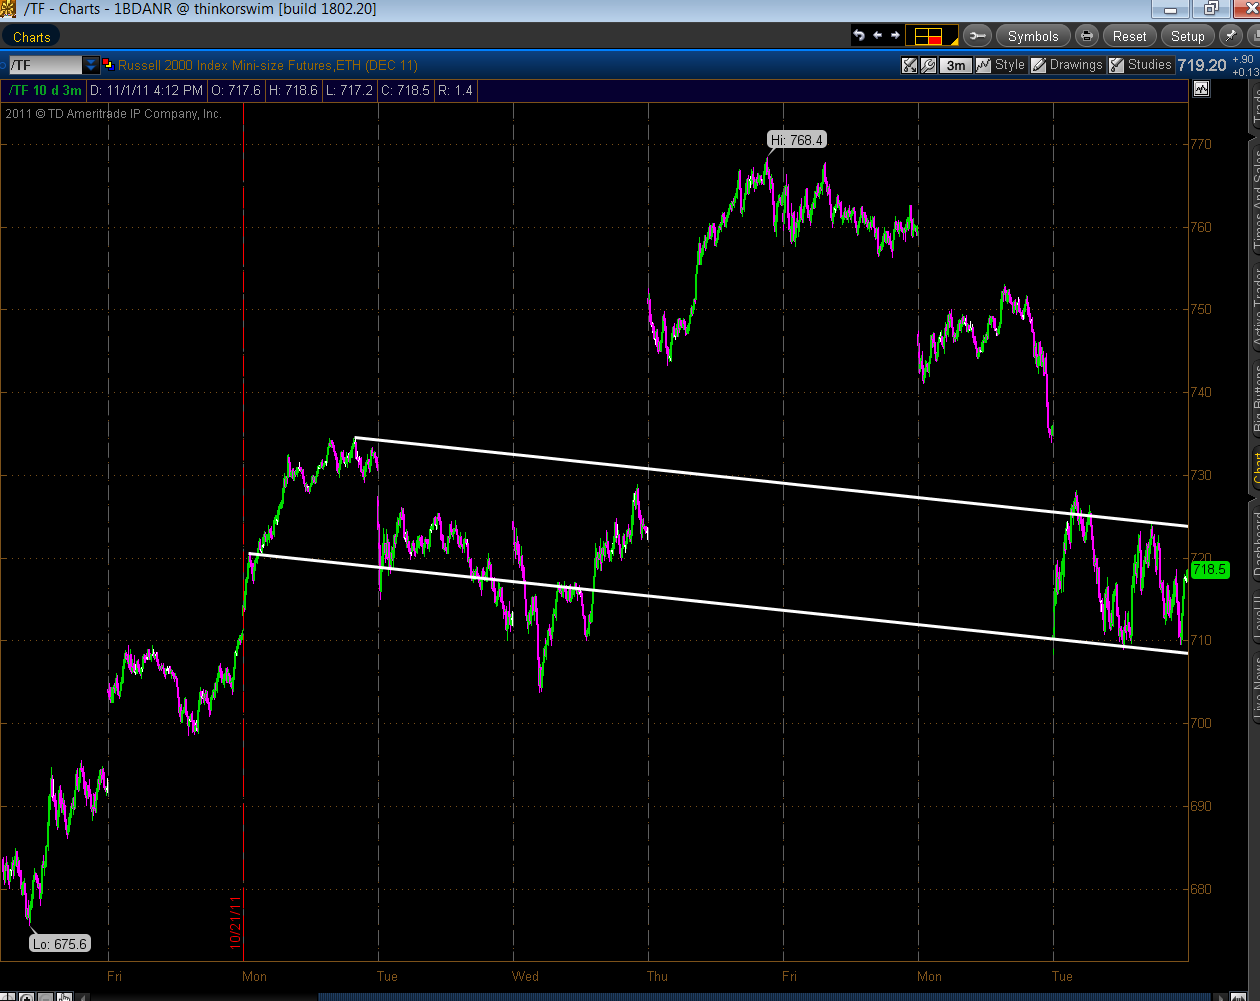
One thing I do know and that is volatility is back...see my earlier post below. With that comes large, unwieldy, non-directional intraday swings like we saw today...the 10-day (market hours only) charts below of the YM, ES, NQ & TF show that price was contained in between near-term resistance and support levels in what could turn out to be a downward-sloping H&S with island-top formation if today's support levels are broken with conviction and held.


The Daily charts below of the YM, ES, NQ & TF confirm that price hit a confluence of Fibonacci and price levels at today's lows...what was near-term resistance is now support...these will be very important levels to be held if the markets are going to resume their trek upwards that began in early October. Otherwise, if these are broken with conviction, they will form resistance once more...this would, of course, send the VIX higher with the promise of more large, unpredictable moves in the equities markets. Furthermore, I'm still mindful that the markets are skating on "thin ice" since they're still trading above unfilled gaps below, as I've mentioned in previous posts.

By the way, today's lows are around the levels that they were at on August 4th, just a day before Standard & Poor's downgraded the U.S. credit rating, which sent prices plunging further.


Volatility is back...

Volatility is back after the past 2 days' action...large intraday swings are not uncommon at these VIX levels:
http://strawberryblondesmarketsummary.blogspot.com/2011/09/money-is-always-interesting-subject.html