WELCOME

Welcome and thank you for visiting!

The charts, graphs and comments in my Trading Blog represent my technical analysis and observations of a variety of world markets...
* Major World Market Indices * Futures Markets * U.S. Sectors and ETFs * Commodities * U.S. Bonds * Forex

N.B.
* The content in my articles is time-sensitive. Each one shows the date and time (New York ET) that I publish them. By the time you read them, market conditions may be quite different than that which is described in my posts, and upon which my analyses are based at that time.
* My posts are also re-published by several other websites and I have no control as to when their editors do so, or for the accuracy in their editing and reproduction of my content.
* In answer to this often-asked question, please be advised that I do not post articles from other writers on my site.
* From time to time, I will add updated market information and charts to some of my articles, so it's worth checking back here occasionally for the latest analyses.

DISCLAIMER: All the information contained within my posts are my opinions only and none of it may be construed as financial or trading advice...please read my full Disclaimer at this link.

Dots

* If the dots don't connect, gather more dots until they do...or, just follow the $$$...

Loyalty

Loyalty

ECONOMIC EVENTS

 UPCOMING (MAJOR) U.S. ECONOMIC EVENTS...

***2024***
* Wed. March 6 @ 2:00 pm ET - Beige Book Report
* Fri. March 8 @ 8:30 am ET - Employment Data
* Wed. March 20 @ 2:00 pm ET - FOMC Rate Announcement + Forecasts and @ 2:30 pm ET - Fed Chair Press Conference
* Wed. April 10 @ 2:00 pm ET - FOMC Meeting Minutes

*** CLICK HERE for link to Economic Calendars for all upcoming events.

Monday, September 25, 2017

A Volatile 2017 Q4 Awaits US Equities

Further to my post of September 25 (regarding GOP legislation failures), watch for an increase in volatility and a potential rotation out of equities (SPX) and into commodities (GOLD and OIL) and currencies (US Dollar) for Q4 of 2017.

With respect to volatility, watch for a potential "SELL" signal to form on the RSI, MACD and PMO technical indicators, as price whipsaws in between major resistance at 250 and major support at 200, as shown on the following SPX:VIX ratio chart.

SPX:VIX Daily Ratio chart

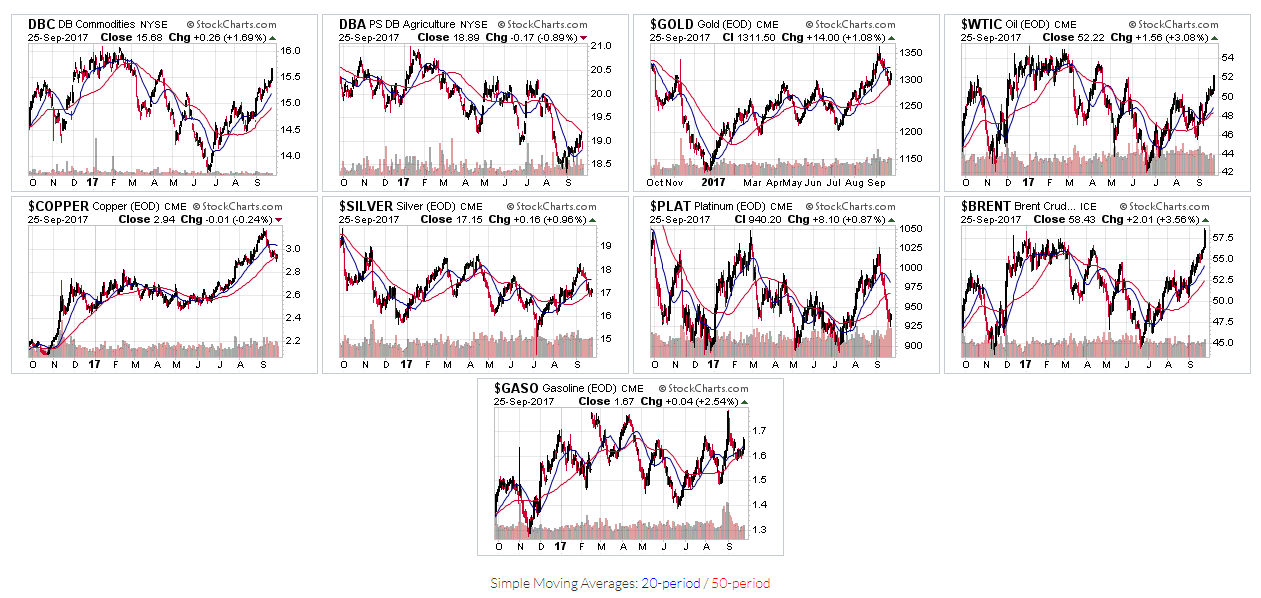
1-Year Daily charts of Commodity ETFs & Commodities

Year-to-date Percentages Gained/Lost graph of Commodity ETFs & Commodities

1-Year Daily charts of Major Currencies

Year-to-date Percentages Gained/Lost graph of Major Currencies