
The Weekly charts below of YM, ES, NQ & TF show that they all closed higher (and on higher volumes) than the prior week. I've added a downtrending channel to the charts this week...price closed at the top of this channel on the YM & ES, and just below on the NQ & TF. Price has moved above last month's Volume Profile POC (yellow horizontal line) on the YM & ES, and closed on or near to it on the NQ & TF. All of them are still trading below their middle Bollinger Band on this timeframe. The YM & TF are still trading below their 1-Year Volume Profile POC (red horizontal dotted line along the right edge of the charts), at its POC on the ES, and above on the NQ.
I'd like to see increasing volumes continue on any advance beyond their closing prices to confirm any potential sustainable breakout and hold above this latest downtrending channel, above the middle Bollinger Band, and, subsequently, above the 1-Year Volume Profile POC...otherwise, look for more volatile and deep intraday swings, and possibly a new low for 2012.

As I mentioned in my weekly market update of April 13th, I'm assigning a weekly bullish or bearish rating on YM, ES, NQ & TF until the end of the year. Please refer to that post for the parameters, and to the Weekly charts below. As of this past week's close, the ratings for next week are as follows:
- YM = moderately bearish (bordering on mildly bearish)
- ES = moderately bearish (bordering on bearish)
- NQ = mildly bullish
- TF = bearish

The Weekly chart below of the NYSE Summation Index shows that a higher weekly close was made to, potentially, confirm a BUY signal for the SPX on this timeframe, as per the Stochastics crossover. This should, however, be viewed in the context of what happens next week on the above charts, based on my comments, as noted.

The three Daily charts below depict support and resistance levels on the percentages of Stocks Above 20-Day, 50-Day, and 200-Day Averages.
Stocks Above 20-Day Averages closed higher than the prior week at 64.84%.

Stocks Above 50-Day Averages closed higher than the prior week at 40.18%.

Stocks Above 200-Day Averages closed marginally higher than the prior week at 51.04%.

I'd conclude that, in the short term stocks are mildly bullish (bordering on moderately bullish), in the medium stocks are mildly bearish, and in the longer term stocks are mildly bullish (bordering on mildly bearish)...as has been the case for the past twelve weeks, all are still on negative watch for further potential weakness.
The VIX fell on the week by 10.4%, as shown on the graph below.

Further to the comments in my last weekly market update, the Daily ratio chart of the SPX:VIX shows that the SPX declined then bounced again to close marginally higher than the prior week and just below major resistance at 65.00 and the prior swing high. Near-term support is at the 200 sma at 58.37. The RSI, MACD, and Stochastics indicators are still trending up, but the Stochastics is approaching overbought territory.

The Daily chart below of the VIX shows that price closed, once again, just above a major support level of 21.00. As I mentioned last week, any reversal to the upside with conviction would need to see the VIX move and stay above 27.00. So, 21.00 and 27.00 remain important levels for the VIX, as does the price action on the ES relative to its Weekly downtrending channel, and the 65.00 resistance level on the SPX:VIX ratio pair, as I mentioned above.

As shown on the graph below of the Industry Groups, the largest gainer on the week was Banks, followed by Biotech, Gold/Silver, and Oil Services, etc.

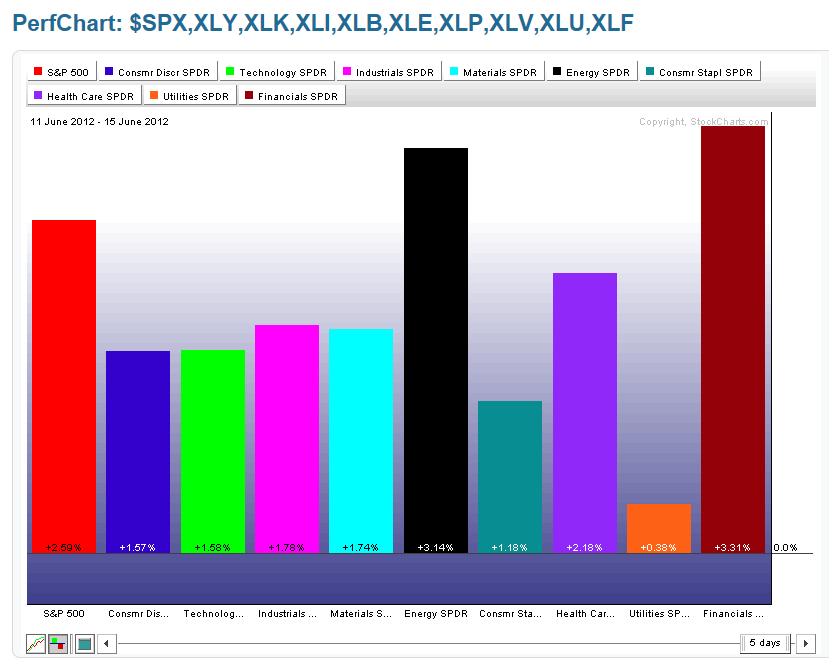
As shown on the graph below of the Major Sectors, the largest gains were made in Financials, Energy, Health Care, Industrials, Materials, Technology, Consumer Discretionary, Consumer Staples, and Utilities...the markets favoured risk-buying over defensive plays, once more.
As shown on the graph below of some of the ETFs, the largest gains were made in the European Fiancials (EUFN), followed by Emerging Markets (EEM), the U.S. Financials (XLF), Chinese Financials (GXC), and Commodities (DBC). Losses were made in Agricultural (DBA).

The Daily charts below of EEM and the BRIC countries show that price is attempting to stabilize...Russia has made a higher swing high. As I mentioned in my last week market update, it's important that the Shanghai Index remain above its critical major support level of 2300. These indices are worth monitoring to see whether they advance along with the U.S. major indices, and hold above immediate resistance levels, as an indication of increasing global confidence in market stability at current levels.

The Daily charts below provide an update on price action on DBC and AUD/USD since my last weekly market update. DBC is attempting to stabilize and potentially reverse, as evidenced by upturning MACD, Stochastics, and RSI indicators. The AUD/USD forex pair has stopped just short of major price resistance of 1.01...a cross (and hold) above zero on the MACD should be positive for price action. They are both trading under the bearish influences of a "Death Cross" formation, and, as such, will likely continue to exhibit volatile (and potential choppy/whippy) price action for awhile. Ones to watch in the days/weeks ahead, as they will likely affect equity markets, as well.

As shown on the graph below, the largest gains were made in Oil, followed by Copper, Gold, and Silver.

The following four Weekly charts of Gold, Oil, Copper, and Silver show support and resistance levels...ones to watch, particularly Gold, Oil, and Copper.


As shown on the graph below of the Major Indices, the Dow 30 gained the most, followed by the Russell 2000, the S&P 500, the Nasdaq 100, the Dow Transports, and the Dow Utilities. There were also gains in the Emerging Markets ETF (EEM), High Dividend-Paying Stocks (DVY), and Corporate Bonds (JNK).

As shown on the currency graph below, money flowed out of the U.S. $ and into the Aussie $, British Pound, Euro, Swiss Franc, Canadian $, and Japanese Yen.

The Daily ratio chart below of the SPX:U.S. $ shows that the SPX rallied and closed just above the 200 sma of 16.32 and below the 50 sma of 16.72...near-term support and resistance levels...one to watch to see if buying pressure increases in equities, and whether the MACD can cross and hold above the zero level.

The next chart of interest is the Weekly chart below of the 30-Year Bonds (ZB). Price has held, once again, above its confluence of trendline and Fibonacci levels...one to watch, since the markets haven't yet divorced from this Bond.

FYI, and further to my post of June 14th, I can now move GXC out of List #2 and into List #1 of stocks/ETFs which have now experienced a bearish "Death Cross" moving average formation on their Daily timeframe. All stocks/ETFs on the three lists are subject to potential volatile intraday swings, and are important ones to watch over the next days/weeks.
In summary, any further meaningful and sustainable advance in the markets will need to be accompanied by unified government fiscal policies which support economic growth and employment (both domestically and globally), and not just by any monetary intervention that may be implemented shortly by world central banks...particularly in view of the U.S. bank stocks that are named in my above-noted three lists. I'd reiterate that the difference between last year and this year is that there is evidence of economic contraction in, not only the European countries, but also in China, Australia, and now the U.S. and Canada...this makes my prior statement all the more important and relevant.
Enjoy your weekend!