WELCOME

Welcome and thank you for visiting!

The charts, graphs and comments in my Trading Blog represent my technical analysis and observations of a variety of world markets...
* Major World Market Indices * Futures Markets * U.S. Sectors and ETFs * Commodities * U.S. Bonds * Forex

N.B.
* The content in my articles is time-sensitive. Each one shows the date and time (New York ET) that I publish them. By the time you read them, market conditions may be quite different than that which is described in my posts, and upon which my analyses are based at that time.
* My posts are also re-published by several other websites and I have no control as to when their editors do so, or for the accuracy in their editing and reproduction of my content.
* In answer to this often-asked question, please be advised that I do not post articles from other writers on my site.
* From time to time, I will add updated market information and charts to some of my articles, so it's worth checking back here occasionally for the latest analyses.

DISCLAIMER: All the information contained within my posts are my opinions only and none of it may be construed as financial or trading advice...please read my full Disclaimer at this link.

Dots

* If the dots don't connect, gather more dots until they do...or, just follow the $$$...

Cat Latte

Cat Latte

ECONOMIC EVENTS

UPCOMING (MAJOR) U.S. ECONOMIC EVENTS...

***2026***
* Wed. Oct. 28 @ 2:00 pm ET - FOMC Rate Announcement and @ 2:30 pm ET - Fed Chair Press Conference

*** CLICK HERE for link to Economic Calendars for all upcoming events.

Monday, May 09, 2022

How Long Can President Biden Survive In 'Survival Mode?'

N.B. This will be a very long and depressing post by the time President Biden's first (and likely only) term is up in January 2025...a refection of his character and policies and the damning effects they are having on Americans, the economy, the environment, the country's national security, as well as the rest of the world's economies and global social stability.

Part I

* See UPDATES below...

Add this disturbing development involving the Supreme Court to the long list of President Biden's failures -- and national security threats that have formed since he took office -- and you've got a very big problem brewing in the U.S. that is contributing to a high level of uncertainty and a general malaise over future prosperity prospects for its citizens and domestic and foreign investors.

So, how long can Joe Biden survive in 'survival mode?' He may barely survive until his four-year term ends, but it's doubtful that many Democrat members of the House and Senate will when their term expires this November, inasmuch as they've enacted his policies (and have pulled him to the extreme far left on many issues) and are directly accountable to their constituents who are negatively impacted by the fallout of Biden's agenda, especially by out-of-control inflation and a high crime wave in their cities.

Look for a 'red wave' to occur during the 2022 mid-term elections, as a result of President Biden's 'lack of courage' to govern the way he promised in his speech when he was sworn into office on January 20, 2021...as a self-professed centrist and a uniter. No one believes his proclamations anymore...but, I doubt many did in the first place.

Market players have already voted with their money...and, it's not favourable for Joe Biden, his agenda, or the Democrat party...see my post of February 21 for further details on major support levels for the SPX pertaining to its break of its Head and Shoulders neckline at 4200.

The SPX closed at 3851.85 the day of President Biden's inauguration. Most of the gains it made since then have been wiped out this year.

Sunday, May 01, 2022

Remedy For Fed-Fuelled Wall St. Gluttony...Purging

* See UPDATES below...

What is Wall Street to do after gorging on cheap money, supplied in abundance by the U.S. Federal Reserve ever since they slammed the brakes on heavy losses caused by the 2008/09 financial crisis?

Purge, of course...as evidenced by the following 10 major technology stocks...all of which are currently in the FNGU ETN basket of stocks.

Judging by the massive haemorrhaging that has occurred this year, it seems that the respective values of these stocks were wildly over-inflated by pure speculation, based solely on cheap money supply...not on the actual value of these stocks and their products/services.

You'd think that the Fed would have learned their lesson by now and not fuelled another stock market bubble, as they've done in the past.

There's no telling where these and other stocks will end up over the next months, but with the Fed pulling the plug on their latest (failed) money-printing experiment, it appears that consumers are finally dictating what their priorities are...and spending their ever-shrinking dollars on basic necessities, and not the 'latest and greatest shiny baubles.'

As long as inflation continues to rage and the global supply chain keeps on sputtering and breaking, with talk of impending recession swirling in the mix, I doubt we'll see equity markets race to new highs over the next several years. Instead, volatility will continue to remain at the forefront of short-lived plunges and spikes in both directions...and indecision will plague market players.

Therefore, I still stand by my market assessment described in my post of March 8.

The following one-year charts of the 10 tech stocks that are within the FNGU ETN basket exemplify the volatility that has plagued equity markets since the beginning of the year, and, in some cases, for a year, or more.

The following graph shows the percentages that these stocks have lost year-to-date.

To add a little more perspective on a couple of these stocks, the following charts compare longer-term monthly price action of NFLX with FNGU and AMZN with FNGU.

I'd say that they, and especially FNGU, portray the gluttony and purging described above.


Some additional details regarding AMZN's poor performance are provided in the following ZeroHedge article.

And, there's this ZeroHedge market analysis...

As an aside, another example of this gluttony and purge scenario is the ARK Innovation ETF, ARKK (containing 141 stocks), as shown on the following monthly chart comparing it to FNGU. You can see that it has traded in lock-step with FNGU over the years.

ZeroHedge has provided a bit more 'colour commentary' on this ETF, as follows.

P.S. To repeat what I said in March..."Best of luck...it's crazy 'out there'...and rumours are flying everywhere!" 😏

* UPDATE May 4...

The Federal Reserve raised interest rates by 0.50% today. 

This tweet sums up where we're at, thanks to the Fed's overly-accommodative policies during the past years...too little, too late...they are a joke.

* UPDATE May 7...

I'm at a loss for words...which doesn't happen very often...

* UPDATE May 19...

The Fed's loose monetary policies have forced people to invest their savings into riskier assets that they wouldn't normally have taken in order to generate a real return...eventually creating bubbles which pop...

* UPDATE July 19...

Leverage, expansion and liquidity are favoured policies of the U.S. Fed...but at what cost? 😕

* UPDATE July 20...

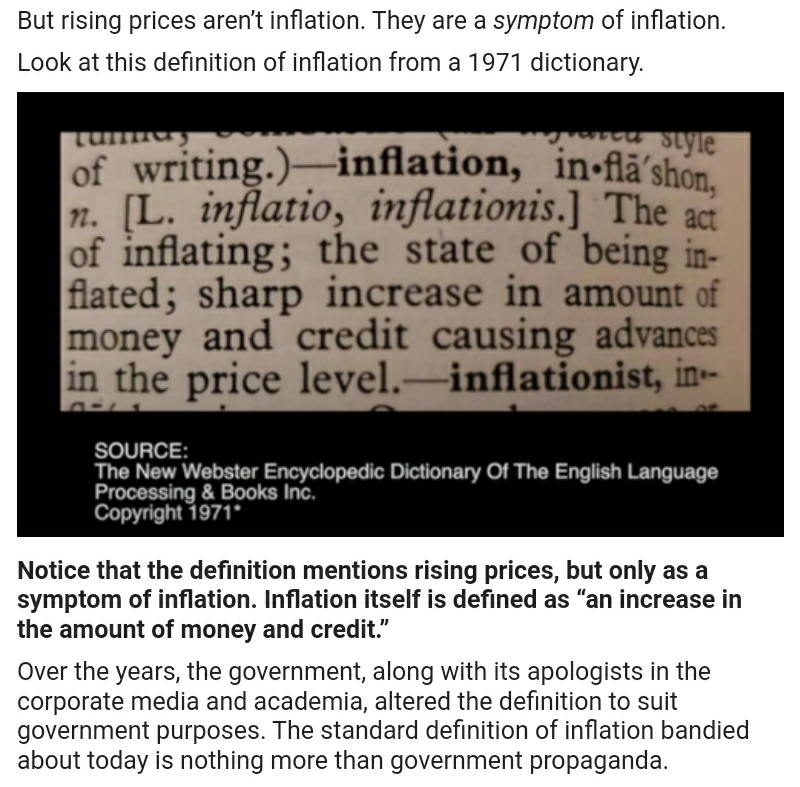
Place the blame for inflation on the Fed and the U.S. government...where it belongs...


ZeroHedge excerpt

* UPDATE Sept. 21...

More pain ahead as the Fed raised their rates another 0.75% today and signalled higher rates for longer...markets dumped and the US Dollar spiked on the news...


ZeroHedge excerpt

* UPDATE Sept. 23...

More confirmation of pain ahead...for consumers, businesses, and markets...as the purging continues...


ZeroHedge excerpt

The SPX has plunged over the past two weeks and is close to retesting its 2022 low of 3636.82, or lower...and Goldman Sachs has a new crash target of 3150.

* N.B. For more Fed UPDATES click this link.


Thursday, April 14, 2022

Twitter's Fair Value

Judging by the number of times that Twitter (TWTR) tried to hold a rally into new highs above 30.00 and failed since its IPO in 2013, I'd have to say that that is precisely where its fair value lies, as shown on the following monthly chart.

By the way, Twitter's performance has been so poor over the years that it was dropped from the FNGU ETN basket of stocks and replaced with MSFT, as noted in my post of February 2.


Monday, March 14, 2022

China's Hang Seng Index Plunges Below Major Support...President Xi's Legacy Hangs In The Balance

* See UPDATES below...

Selling has acceletated to an all-time extreme level -- even exceeding that which occurred during the 2008/09 financial crisis -- in China's Hang Seng Futures Index (HK50), which has plunged below a major support level of 20,000 in Sunday night's wild trading, as shown on the following monthly chart (the price is still dropping as I write this post).

This follows my post of March 7, which warned of possible impending weakness in China's Shanghai Index (SSEC) due to diverging extreme weakness in its Financials ETF, GXC.

Failure to recapture and hold above 20,000 could see a swift plunge to 16,000, or lower.

The following article describes 11 major crises that China is facing, which may have contributed to its 4.3%+ drop, so far, from Friday's close.

N.B. The Hang Seng Index closed at 19,531.66 on Monday for a loss of 5.0% from Friday. As well, China's Hang Seng Tech Index lost 11%, the most ever...the Hang Seng China Enterprise Index lost 7.2%, the most since November 2008...and the Golden Dragon China Index lost 13%, for a two-day loss of nearly 30%...see this ZeroHedge report for details.

CONCLUSIONS

  • Perhaps President Xi will rethink his recent no-limits alliance with Russian President Putin -- due to Putin's new-found status as the "world's pariah" and the indiscriminate slaughter of innocent women and children and the war crimes he's committing in his barbaric war on Ukraine (moving ever closer to NATO neighbouring countries, in the process) -- and reconsider whether he, either, wishes China to remain a viable trading partner (and become more stable and trustworthy in the process) and attract foreign investment from the West, or risk losing that privilege altogether.
  • Either the world moves backward into fractured, unstable, waring, and bloody medieval times, dominated by unending depressions, famines and disease...or it moves into the 21st Century with grace and stability...or, it is obliterated by world-wide nuclear war.
  • President Xi has a big part to play in that decision.
  • Either way, he will be held responsible...and his legacy (and, by extension, China's) will reflect that choice, which he'll need to make, sooner rather than later.
 

N.B. The nuclear "Doomsday Clock" is ticking...and is now at "100 seconds to midnight," as noted in the following report...thereby, making President Xi's decisions that much more critical and urgent.

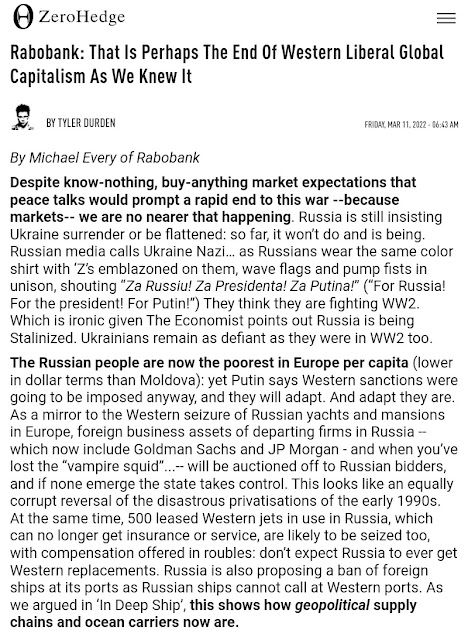
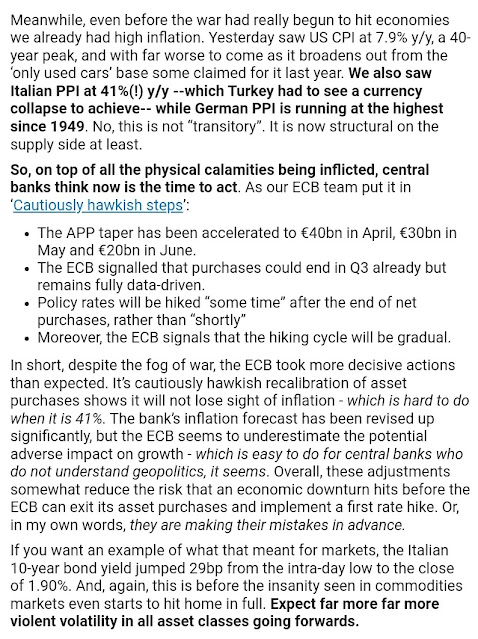
ZeroHedge excerpt

ZeroHedge excerpt

* UPDATE March 15...

Selling accelerated in overnight trading in China, as shown on the following monthly chart of the Hang Seng Index (HK50). It closed at 18,415.08 and lost another 5.72%. It was another bloodbath in Chinese major indices, as shown in the following table.

I've shown the chart in an "area" format to illustrate that any gains made since November 2006 have never held, to date...hinting that there has been something systemically wrong in China and its economy since then -- in the months leading up to the 2008/09 financial crisis and global market crash, and ever since -- and signalling that, what was wrong/broken, then, has never been fixed.

SO, if President Xi thinks that, by hitching up China's wagon to Putin's horse will make that situation any better, then I've got a bridge to sell him! 😕


More information on China's markets can be found in the following ZeroHedge article...it's not pretty.

* UPDATE July 18...

More trouble ahead for China...this time, it's their housing market...

* UPDATE July 25...

With investors pulling their money out of China on a scale second in size to the COVID crash, there is a "threat of a further disintegration of their financial system should their housing crash escalate further"...

* UPDATE July 31...

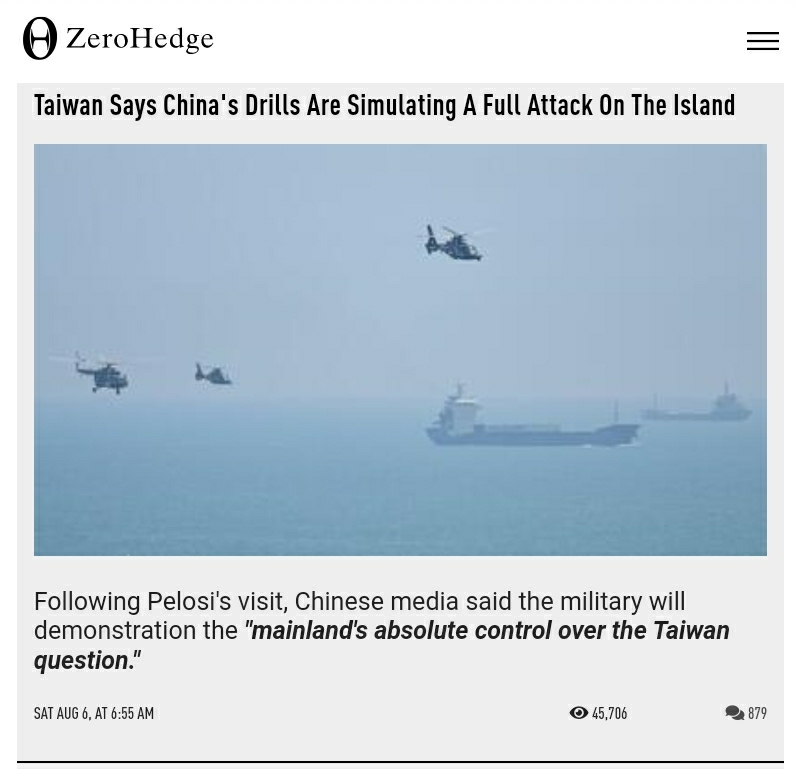
Tensions are heating up between the U.S. and China to dangerous levels...adding to an already-risky foreign investment environment in China...

* UPDATE August 6...

Oh, look...a military distraction is being conducted by China, while its Shanghai Index (SSEC) and Financial ETF (GXC) are poised to plunge below near-term fragile support, as shown on the monthly charts below.

The SSEC has had difficulty holding above 2500 since November 2006. Near-term support sits at 3000, while longer-term major support lies at 2000.

Near-term support for GXC sits at 80.00, while longer-term major support lies at 60.00.

A drop and hold below 3000 for the SSEC and 80.00 for GXC could send China's markets plummeting in short order.


* UPDATE Aug. 8...

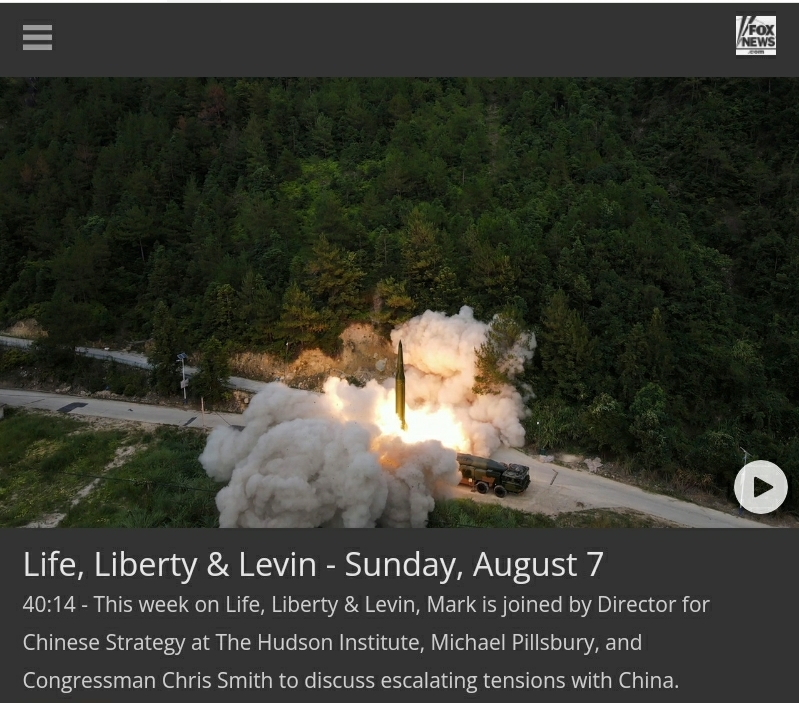
The growing global threats posed by China -- militarily, economically, financially, ecologically, environmentally, human rights abuses, global supply chain disruptions/blockades, etc. -- are described and discussed in detail in the following Life, Liberty & Levin video...

N.B. Further UPDATES can be found here.


Friday, March 11, 2022

HYG: High Yield Corporate Bond ETF Nears A Tipping Point

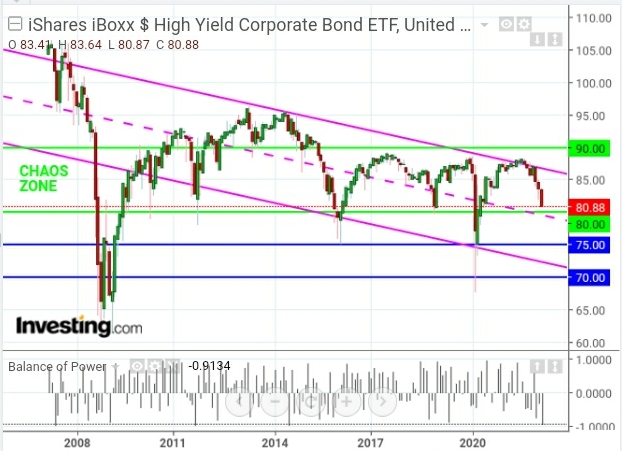
Depicted on the following monthly chart of the High Yield Corporate Bond ETF (HYG) are a long-term downtrending channel, several horizontal support and resistance levels, and a large sideways "CHAOS ZONE."

HYG's current push downward is accelerating and is fast approaching a confluence of price and channel median support around 80.00.

It has been trapped, for the most part, in a volatile and whippy "CHAOS ZONE" in between 80.00 and 90.00 since mid-2009.

A drop and hold below 80.00 on accelerating selling (depicted on the Balance of Power indicator and is now at an extreme level) could see it retest 75.00 or 70.00, or plunge even lower, in short order.

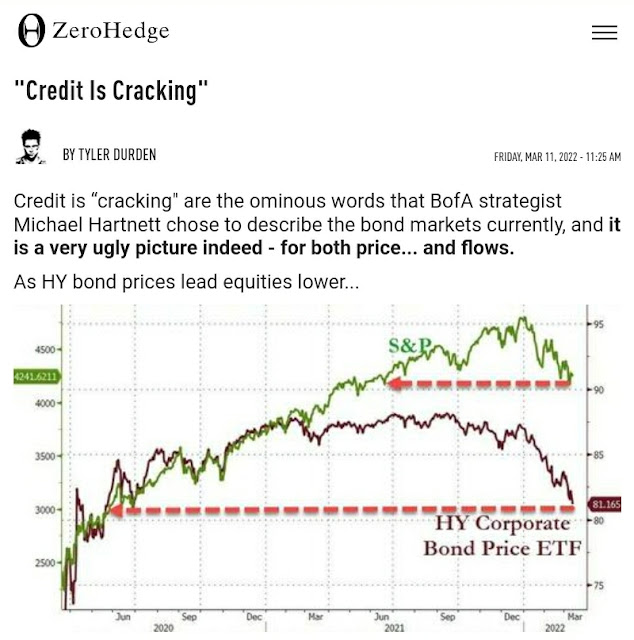
For further clues on possible direction, check out the following information.

The article below contains relevant and important details on HYG and the credit markets, and their potential impacts on equity markets...definitely worth a read.


Thursday, March 10, 2022

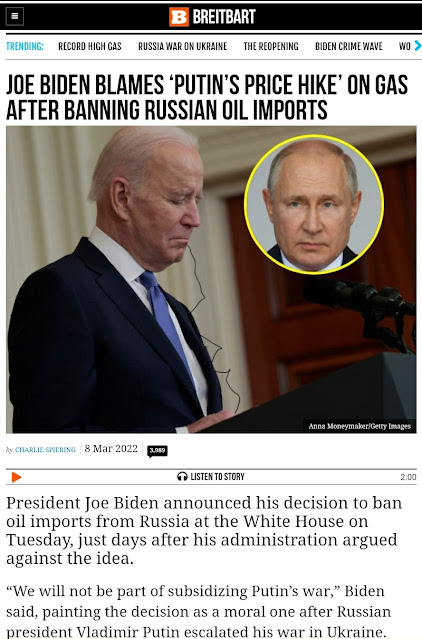
'Putin's Price Hike' And Inflation/Wages: White House "Spin" Debunked

* See UPDATE below...

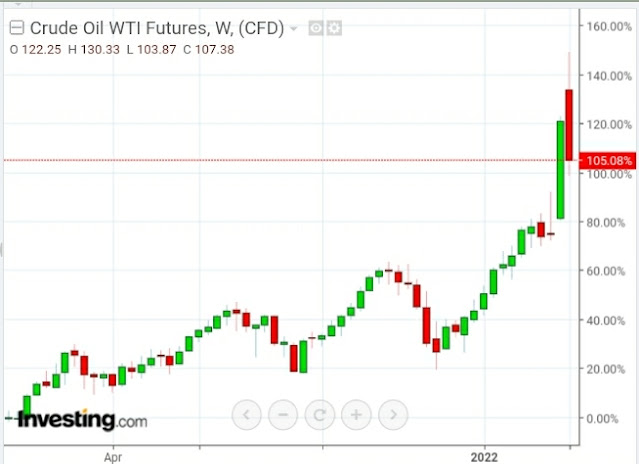
The following weekly chart of WTI Crude Oil shows that, from the day that President Biden took office on January 20, 2021, it has gained around 105%, to date...that has resulted in incrementally higher gasoline prices since then.

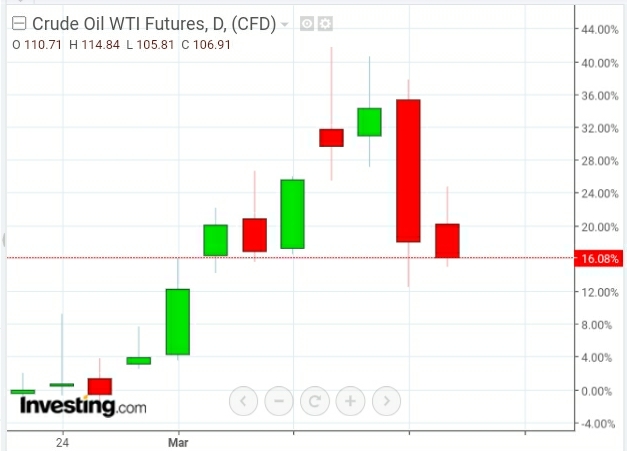
Russian President Putin declared war and invaded Ukraine on February 23. Since then, oil gained around 16%, as shown on the following daily chart...just a fraction of its overall gain since Biden became President and declared his own war on U.S. oil and gas drilling and production, as well as new pipelines.

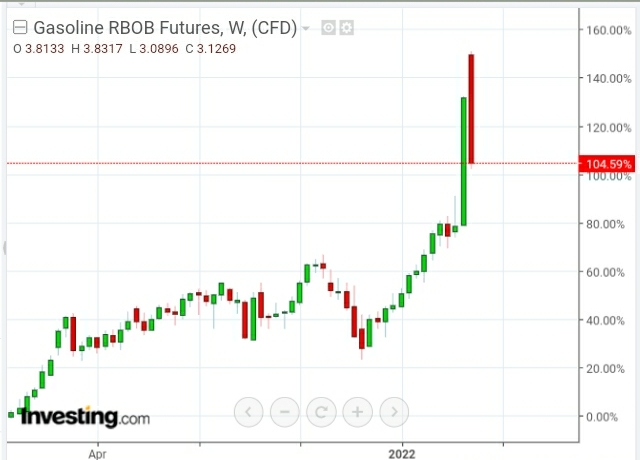
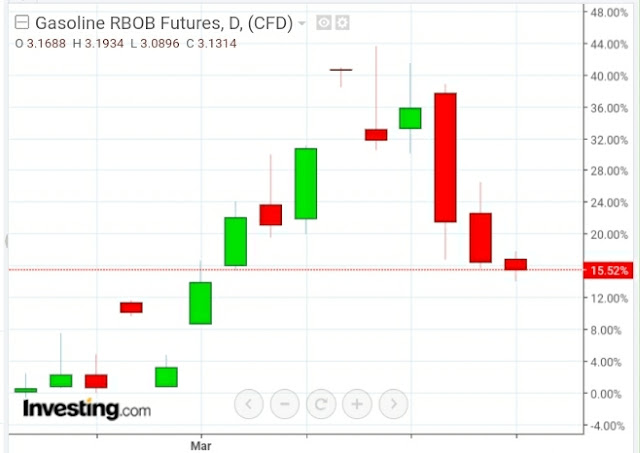
You can see similar increases in RBOB Gasoline...104.59% from January 20, 2021 and 15.52% from February 23, as shown on the following weekly and daily charts, respectively.

Since the 'war segment' represents only a small portion of the overall increase, the bulk of the increase has occured since President Biden took office.


Much of the increase in oil and gasoline are a result of global ESG policies, exacerbated by the war in Ukraine, and will likely worsen over time and lead to a recession, according to this report.

These facts indicate that, after banning Russian oil imports into the U.S. on March 8, President Biden's attempts to blame high gas prices entirely on President Putin are erroneous.

Instead, the majority of these increases have happened since Day One of Biden's presidency.

As an aside, both Oil and Gasoline Futures topped out on March 7...the day before the ban.

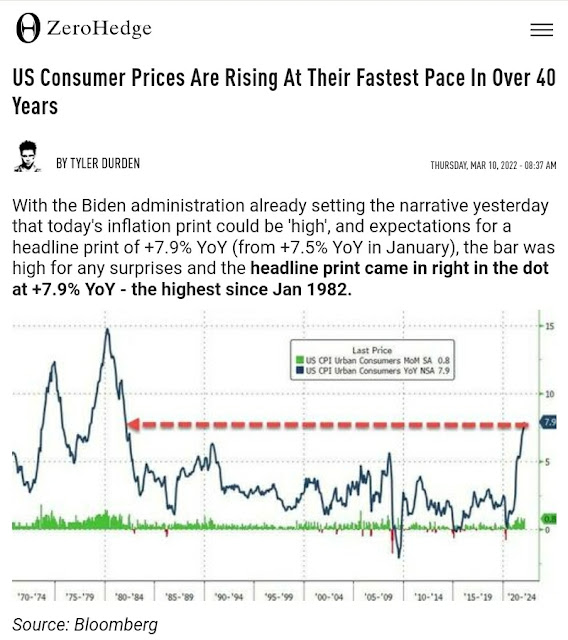
Inflation has risen to 7.9% YoY, to date...the highest since 1982.

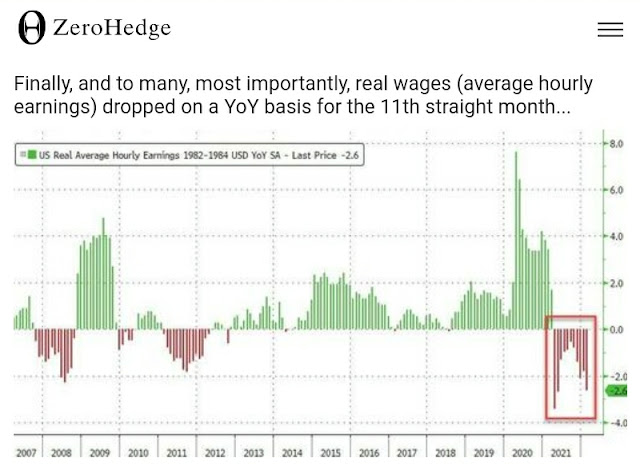
Joe Biden's repeated claims that wages have kept up to the rate of inflation are also false, as noted below.


ZeroHedge excerpt

ZeroHedge excerpt

These are not the first occasions when Joe Biden has blatantly lied to Americans, and I doubt they will be the last. There are numerous examples sprinkled throughout my articles at this link.

* UPDATE March 11...

If you still think that inflation is "transitory," you will be in for a nasty surprise...this article spells out why it's not. 

It looks like things will only get much worse from here. Global political and economic bifurcation has begun.


ZeroHedge excerpt