WELCOME

Welcome and thank you for visiting!

The charts, graphs and comments in my Trading Blog represent my technical analysis and observations of a variety of world markets...
* Major World Market Indices * Futures Markets * U.S. Sectors and ETFs * Commodities * U.S. Bonds * Forex

N.B.
* The content in my articles is time-sensitive. Each one shows the date and time (New York ET) that I publish them. By the time you read them, market conditions may be quite different than that which is described in my posts, and upon which my analyses are based at that time.
* My posts are also re-published by several other websites and I have no control as to when their editors do so, or for the accuracy in their editing and reproduction of my content.
* In answer to this often-asked question, please be advised that I do not post articles from other writers on my site.
* From time to time, I will add updated market information and charts to some of my articles, so it's worth checking back here occasionally for the latest analyses.

DISCLAIMER: All the information contained within my posts are my opinions only and none of it may be construed as financial or trading advice...please read my full Disclaimer at this link.

Dots

* If the dots don't connect, gather more dots until they do...or, just follow the $$$...

Convertible at Beach

Convertible at Beach

ECONOMIC EVENTS

UPCOMING (MAJOR) U.S. ECONOMIC EVENTS...

***2026***
* Wed. Sept. 16 @ 2:00 pm ET - FOMC Rate Announcement and @ 2:30 pm ET - Fed Chair Press Conference

*** CLICK HERE for link to Economic Calendars for all upcoming events.

Wednesday, August 26, 2015

SPX vs SSEC vs USD:JPY

Notice the correlation among these three instruments...namely, SPX (S&P 500 Index) vs SSEC (Shanghai Index) vs USD:JPY (U.S. $ & Japanese Yen Forex pair).

They've pretty much moved in tandem for several years, now...until very recently, when the SSEC plunged to a much greater extent than the other two, and the U.S. $/Yen Forex pair a bit stronger than the SPX.

I'd keep a close eye on the SSEC for any signs of recovery, and, if there's none soon, we may see another (substantial) leg down on that, with, possibly, SPX and USD:JPY following suit. (You can read further details on the SSEC here at this link.)


Thursday, August 20, 2015

SPX:VIX Ratio At The Brink

* N.B. See Friday's &  Monday's UPDATES below...

Thursday, August 20th:
Note the aggressive selling on the SPX when the SPX:VIX ratio gets up to the 180 level. A drop and hold below the 100 major support level could spell big trouble for the SPX and the other Major U.S. Indices.

With the Momentum indicator in a downtrend on this timeframe, I wouldn't be surprised to see a larger pullback occur in the equity markets. Watch the 2038 level on the SPX, as mentioned in my post of August 14th, for confirmation.

SPX:VIX Monthly Ratio Chart

As well, we should see a bearish moving average Death Cross form on the World Market Index, possibly as soon as tomorrow's (Friday's) close...see my post of August 19th for more information on this, as this (along with upcoming action in Chinese markets) could very well weigh heavily on U.S. markets.

World Market Index Daily chart

* UPDATE Friday, August 21st:

Failure to hold the 60.00 level on the SPX:VIX ratio chart could cause some panic selling in equities, as I mentioned in last year's post of October 15th, 2014. Price closed just above 70.00 today (Friday), as shown on the following Monthly chart. The Momentum indicator is now sitting at the lowest levels seen in the past 20 years...an ominous sign of things to come.

SPX:VIX Monthly Ratio Chart

As far as the World Market Index is concerned, price fell further today, but I was a day early in the bearish moving average Death Cross formation -- that will likely happen on Monday -- forecasting another "sell" signal for world equity markets.

World Market Index Daily chart

* UPDATE Monday, August 24th:

Here's a look at how World Market Indices closed today...the selloff began overnight in Asia and continued into the rest of world equity markets, where, approximately, $5 Trillion in profits were wiped out.

World Market Indices

Price closed today well below the 60.00 major support level (mentioned above)...and, as you can see from the data above, the percentage world market selloff was considerable, including that of the U.S. equity markets. Look for more of the same, as long as price on this ratio chart remains anywhere below the 110.00 - 60.00 range...the Momentum indicator continued its plunge to even lower 20-year levels, as well, today, to signal more volatility and weakness ahead for the SPX.

SPX:VIX Monthly Ratio Chart

We finally saw a bearish moving average Death Cross form today on the World Market Index, forecasting further weakness and another "sell" signal for world equity markets.

Price has dropped below its first major support level of 1700 and appears to be headed towards the next one at 1600. Whether this continues to plunge without a small bounce in between remains to be seen.

World Market Index Daily chart

I'd also include the following 1-Year Daily chartgrid of Foreign ETFs. The daily ATRs (average trading ranges) are shown in white along the bottom of each chart. Today's extreme spike in range tells me that we are seeing the beginnings of major volatility and weakness entering these ETFs...confirming what the above charts are forecasting.

Foreign ETFs 1-Year Daily charts

Wednesday, August 19, 2015

Commodity "Bits & Bites" -- GOLD, COPPER & OIL

Here's my quick take on Gold, Copper, and Oil...

GOLD
  • a drop and hold below 1072.30 on GOLD could, finally, see price retest the 1000 level, or lower, since there is an absence of volume support down to this level, according to the Volume Profile shown along the far right side of the chart
  • 1150 = major resistance
GOLD Weekly

COPPER
  • a drop and hold below the current price on COPPER (2.274 and now sitting at the downtrend channel "mean") could send price plunging
  • 2.385 = major resistance
COPPER Weekly

OIL
  • OIL is now sitting at 2004 prices
  • it could drop as low as 33.20 (major support), or lower...no end in sight, since there is little volume support down to this level, according to the Volume Profile shown along the far right side of the chart
OIL Weekly

The Highs and Lows of the SPX

You can see from the Daily chart of the SPX below that the recent long-tailed hammer off the 200 MA failed to confirm the beginning of a new bull market trend.

The roller-coaster sideways movement of the SPX for 2015 will likely persist until, at least, the September Fed meeting, when markets are anticipating the first rate hike. Until then, we may continue to see failure of (sustainable) breakouts in either direction.


If we see a bearish moving average Death Cross form on the World Market Index (as appears imminent soon on the Daily chart below), this would confirm a weakening global economy and would likely drag the U.S. markets down, as well -- possibly, before the September Fed meeting. This is one chart to keep an eye on, as well as China's Shanghai's Index.


Friday, August 14, 2015

SPX: Bull/Bear Line-in-the-Sand Level

Just glancing at this 5-Year Daily chart of the SPX, I'd have to say that 2038 (300 MA) represents major support  as the Bull/Bear line-in-the-sand level...plain and simple.


Tuesday, August 11, 2015

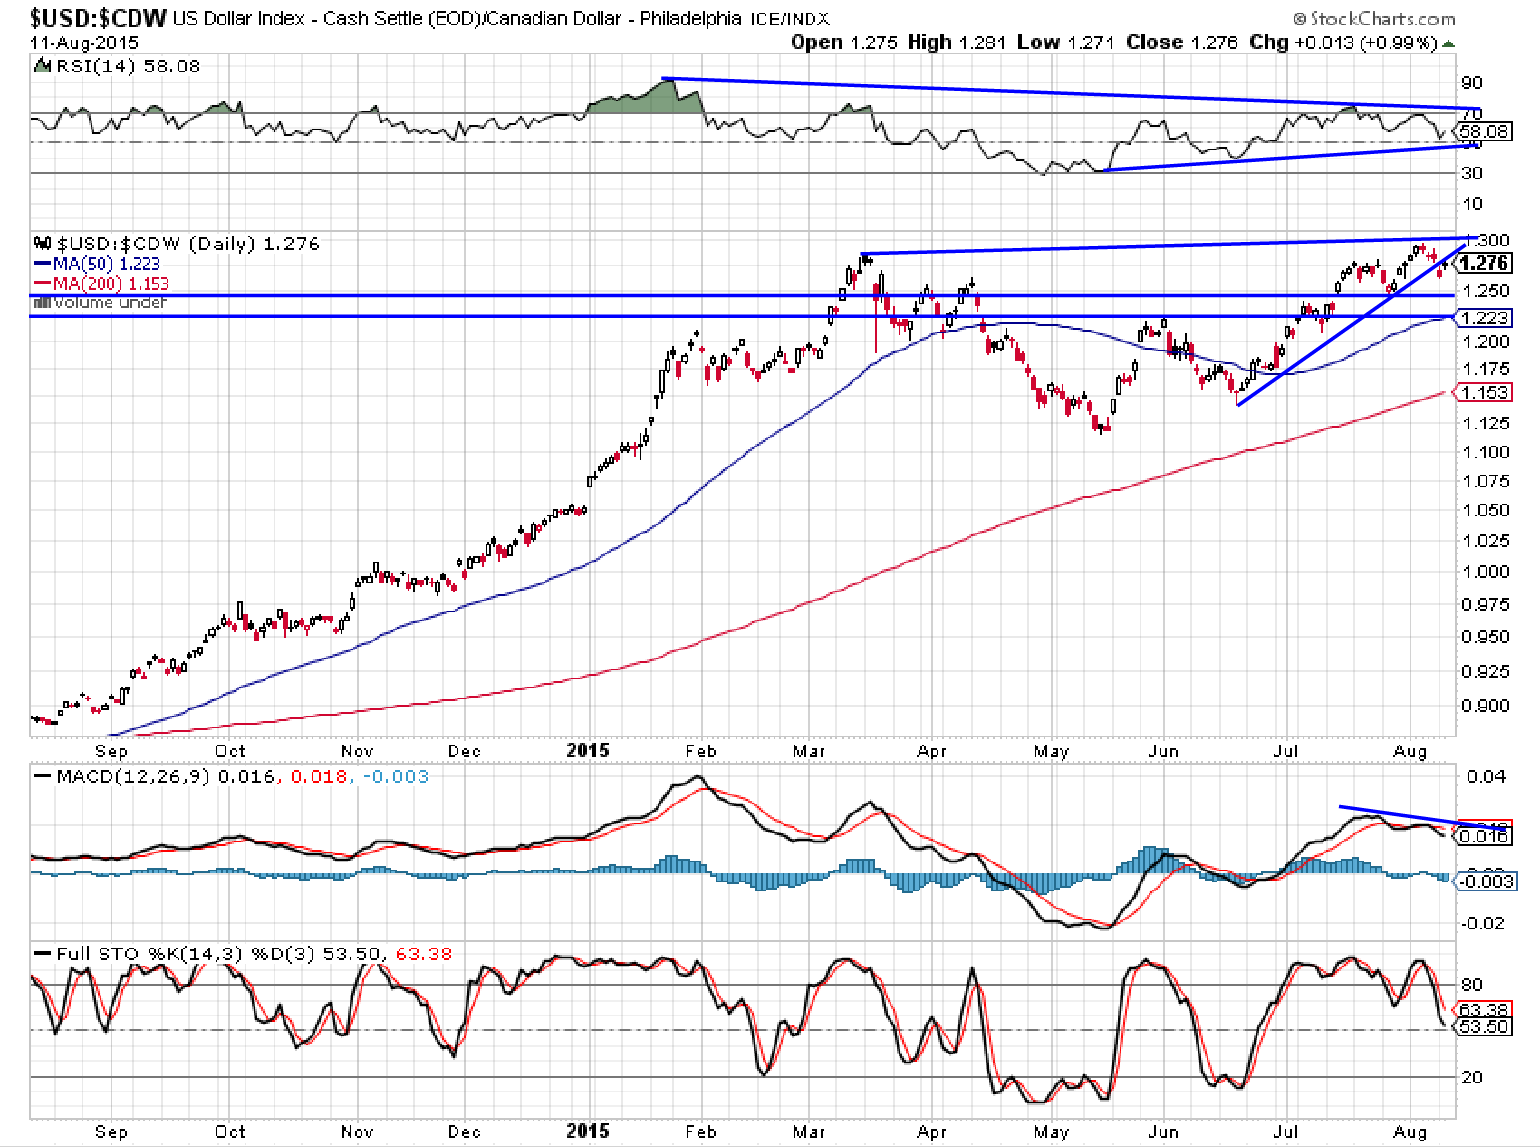
US $ vs Cdn $: Commodity Price Turnaround Coming?

We may see a turnaround sometime soon on this USD:CDW forex pair.

A break and hold below 50 on the RSI could signal a retest of the 1.250 price level, or lower at the 50 MA at 1.223. The bearish crossovers on the MACD and Stochastics are forecasting lower prices for this forex pair.

If we see a pop in Oil and Gold, we should see the Canadian $ regain some of its losses against the U.S. $. Since somebody bought today's (Tuesday's) intraday dip (big-time) on Canada's TSX to the tune of 150 points from its low of the day, this could be hinting of higher commodity prices. Watch it for clues in the short term; otherwise, today's action may have just been an opportunity to short the Canadian equity and currency markets (and some commodities) at short-lived higher prices.


Monday, August 10, 2015

SPX: No "Free" Market Here

SPX: 2015 has been the most "muted" market (and probably most hated for momentum players) in the past 5 years -- RSI has not hit either 70 or 30 this year -- someone's got this market "muzzled," so no "free" market here.


UPDATE August 12:

Market still locked up tight...thanks to world Central Banks' currency wars...


Sunday, August 02, 2015

Lumber vs. Homebuilders: The Great Disconnect

Lumber and the Homebuilders ETF (XHB) traded, essentially, in the same directions from mid-2010 until October 2014 -- when Lumber suddenly took a nosedive down to major support at 240, while XHB broke out and rallied -- as shown on the following 5-Year Daily comparison chart.

At the moment, it looks as though that support level will be retested, once more. A drop and hold below 240 could very well be the catalyst that breaks XHB's slightly-sloping (tight) uptrend. And, a drop and hold below 220 could see a very quick, sizable plunge in XHB...possibly slicing through 34.00 down to retest major support around 28.00, or lower.

Lumber and Homebuilders ETF...two charts to monitor to see if the current spread between them continues to widen or shift.


* UPDATE -- Click this link to view an interesting read, dated September 17th, from Tom McClellan regarding New Home Sales vs Lumber...another correlation to monitor in the coming weeks and months.

Tuesday, July 28, 2015

Fed Stimulus "Canaries" About to Croak?

I last wrote about the Fed Monetary Stimulus "Canaries" in my post of December 16, 2014. As a reminder, I chose six of them (ETFs) in order to determine their relative strength/weakness against their respective Stock Market Index, since they may have held clues for further accumulation in riskier assets due to respective Central Bank stimulus programs.

So that we can compare their current relative strength/weakness, I've provided the following 5-Year Daily ratio charts for each "Canary."

OBSERVATIONS


XLF:SPX -- U.S. Financials ETF (XLF) has, basically, traded lock-step with the SPX. A recent breakout has failed and brought price back below major resistance. We'll need to see price retake the 0.0121 level, first, then 0.0122, if XLF is going to resume an outperformance of the SPX...however, the RSI failed to make a higher swing high relative to the higher swing price high, so I'm doubtful that we'll see the XLF move higher before it, potentially, retests the 200 MA.


EUFN:STOX50 -- European Financials ETF (EUFN) was underperforming the European Index (STOX50) until mid-March of this year, but has rallied and has consolidated in between the 50 and 200 MAs. Price action is still under the bearish influences of a moving average Death Cross formation, so it is subject to reversal if it fails to break out and hold above major resistance at 0.0073 and a bullish moving average Golden Cross forms.


GXC:SSEC -- Chinese Financials ETF (GXC) has drastically underperformed the Shanghai Index (SSEC) since July of 2014. The shockwave that I warned against in my above-noted post did occur in this ETF, but had the opposite effect on the Index, once the major support level of 0.025 was broken...however, once the last support level of 0.022 was broken, we started to see the Index weaken and, ultimately, implode. A strong Index is only as good as its financials to support it, in the long run, so we'd need to see price reclaim (and hold above) 0.025 and higher; otherwise, I'd look for considerable weakness ahead in the Index, as I warned here.


XHB:SPX -- Homebuilders ETF has, essentially, traded sideways (along with the SPX) since January of this year. We'll need to see a solid breakout and hold above 0.0180 to convince bulls that this ETF was going to outperform for the remainder of this year...we may see a brief pop until such time as the Fed raises interest rates.


RTH:SPX -- Retail ETF has outperformed the SPX since mid-June of this year, after retreating from its highs in March. So far, price has retested and failed to break out and hold above those highs, which it will need to do in order to regain its leadership...otherwise, it's in danger of falling back to its 200 MA, or lower (to erase all of its gains for 2015).


EEM:SPX -- Emerging Markets ETF has continued to underperform the SPX and has, in fact, broken below this year's major support level. Once again, we see price under the bearish influences of a moving average Death Cross formation...price would need to reclaim (and hold above) 0.022 and a bullish moving average Golden Cross form; otherwise, we could very well see an acceleration of downside pressure occur on EEM.


SUMMARY


  • Chinese and European Financials are very weak and do not support their respective Indices
  • U.S. Financial ETF is at a crossroads and looks like it's in for some weakness
  • Homebuilders ETF is up against considerable resistance and could be in for some weakness
  • Retail ETF is pushing on a string at these all-time highs and overbought levels
  • Emerging Markets ETF is falling off a cliff

CONCLUSIONS


It would appear that these six "Canaries" are about to fall (further, in some cases) off their perch...charts worth monitoring to see where the cracks begin or widen to suggest that the effectiveness of these Central Banks' policies has run its course.

Sunday, July 26, 2015

30-Year U.S. Bonds at Crossroads

The following 1-Year Daily chart of 30-Year U.S. Bonds ($USB) shows that a bearish moving average Death Cross has recently formed -- warning that lower prices may be in store. However, the rising RSI indicates building strength from May through July.


Near-term major resistance lies at 155.00, while longer-term major support sits at 150.00, as shown on the following 5-Year Daily chart. We may see price break through both sides of this 150.00-155.00 consolidation zone before market participants make a final decision "for" or "against" this bond...watch to see which side of 50.00 that the RSI, either, aligns with, or diverges from, that final choice to confirm sustainability of that direction.


The key to direction may lie in how well the U.S. $ performs in the near-term. The following 5-Year Daily chart of $USD compares price action to $USB. Price has, basically, moved in tandem on both of these instruments since mid-2013. The RSI is still in an uptrend from May and above the 50.00 level on $USD, and major price resistance lies at 98.00.


However, the following 5-Year Daily ratio chart of $USD:$USB shows that, recent attempts by $USD to break and hold above the 98.00 price level have been futile, while buying has strengthened each time in $USB. I'd watch the 0.630 major support level on this chart to see if the U.S. $ can regain a bullish bias...a breakout and hold above 0.660, together with a move on the RSI back above the 50.00 level would reinforce that scenario.


Wednesday, July 08, 2015

China's Shanghai Index: The Falling Knife

* See UPDATES below...

Further to my post of June 8th, here's what has happened, since then, on China's Shanghai Index.

After making a slightly higher high of 5178.19 on June 11th, it has since plunged to a low today (July 8th) of 3421.53 to close at 3507.19...slightly above its 200 Day Moving Average -- making a loss of 1671 points from high to close, thus far.

The first level of major supports sits around 3000...the next around 2500...a solid break and hold below 2000 could cause major panic in markets around the world.

So far, attempts by the Chinese Central Bank to intervene and stop this falling knife have failed...we'll see if this market can find any stability at any of the above-noted levels. There are no "buy" signals at this time on the RSI, MACD, and Stochastics indicators -- rather, they are still bearish, although quite oversold; however, the extreme bearish force of the MACD, in particular, should be respected, as we could, very well, see much more selling in the short term.


* UPDATE July 27, 2015:


* UPDATE August 25, 2015:

Major support now sits in between 2750 and 2500, as price has closed below 3000 today -- now major resistance.


* UPDATE September 7, 2015:

China's Shanghai Index is about to experience a bearish moving average Death Cross...likely by tomorrow's or Wednesday's close. The RSI and PMO indicators are indicating further weakness to come.

At the moment, price (after bouncing back from its price noted in my above UPDATE) is trading at just above the major support level of 3000...a drop and hold below could, very well, see price falling back to somewhere in between 2750 and 2500, or 2000, or even lower. If price holds above 3000, we may see price rally to retest the Death Cross around 3700, before we see further weakness and lower swing lows...however, failure to close the gap below 3500 would likely spell major trouble for this index and see price plunge rather quickly to new lows for 2015.


* UPDATE September 8, 2015:

Bearish moving average Death Cross formed today...yesterday's comments (noted above) apply...


Tuesday, June 30, 2015

SPX Candle Review of the First Half of 2015

Q2 of 2015 closed today (Tuesday, June 30th). The following describes candle action, to date, in four timeframes -- namely, Yearly, Quarterly, Monthly, and Weekly timeframes.

Each candle shown on the following chart of the SPX represents One Year.

The first half of this year is depicted by a "doji," as of the close on June 30th -- spelling "indecision" by this equity market. So far, the close is a mere 4.21 points higher than its open on January 2nd...not much of a gain in six months...no surprise, since price has been held back by the 161.8% External Fibonacci Retracement level (taken from the last major swing high in 2007 to the 2009 low), which is a typical major Fibonacci profit-taking level.


Each candle on this next chart of the SPX represents One Quarter of One Year.

Q1 of this year is depicted by a "spinning top" -- spelling "indecision" by this equity market. Q2 of this year is depicted by a "shooting star" with a slightly lower close than Q1 -- spelling a rejection of higher prices and a "bearish tilt" to this market.


FURTHER OBSERVATIONS...

Momentum has declined since 2014 on both charts -- confirming the lack of bullish confidence and commitment in this index. Candle action on both charts shows that major profit-taking has occurred in a considerable number of stocks in this index, so far, this year. In order to confirm that bears have taken firm control of this index going into Q4 of this year, we'll need to see a lower close on the Q3 candle (which begins tomorrow) on September 30th.

DRILLING DOWN...

However, looking at two shorter time frames:
  • because of June's "bearish engulfing" candle, we'll need to see a lower close for the upcoming July candle on the following Monthly chart to signal further medium-term bear strength going into August, and
  • because of last week's "bear harami" candle and a lower price below that close, so far, this week, we'll need to see a lower close by the end of this week on the following Weekly chart to confirm further short-term bear strength going into next week.

So, I'd watch for lower lows on this week's candle with a lower close on Friday, and, then, a lower low on July's candle with a lower close on July 31st -- also, a drop and hold of the Momentum indicator below the zero level on both charts (it has already dropped below zero on the Weekly timeframe) -- to warn of bearish control of this index going into August.


Monday, June 29, 2015

Bull/Bear Struggle for Control of EUR/USD

The following Monthly chart of EUR/USD Forex pair shows that price has been bouncing (generally) between 1.15 (dotted yellow horizontal line) and 1.08 (solid yellow horizontal line) since February of this year.

At the moment, 1.15 is defined by a confluence of a Fibonacci fanline and a falling trendline...1.08 sits around the lower one-third level of the large price range between the 2000 lows and the 2008 highs.

Bulls will need to reclaim, firstly, the 1.15 level, then 1.19 and 1.21...Bears will need to drop price below 1.08 to, potentially, 1.02 or lower. However, price support is much lighter at 1.02, as shown on the TPO Profile along the right edge of the chart, so price could slice right through that level before finding stability at a much lower level -- the lower "value" level (blue horizontal line) of the TPO Profile shows that near-term price support sits at 1.10...an important Line-in-the-Sand level for Bulls to hold and Bears to break.


Tuesday, June 23, 2015

Re-test of 98 in Store for U.S. Dollar?

The U.S. Dollar is back above the major support level of 95 after a brief break below, as shown on the Daily chart (cash index) below. As I mentioned here and here recently, I believe a large move is coming, one way or the other, in currencies. The RSI indicator is back above the 50 level, hinting that bulls are back in charge of $USD.

A re-test of 98 is not out of the realm of possibilities next and will be the first major resistance level that will need to be overcome to convince traders to pile in on this trade...assuming price breaks back (and holds) above the declining 50 MA around 96 immediately above today's (Tuesday's) close...coincidentally, there is a confluence of major resistance at the 96 level -- formed by a Fibonacci fanline and mid-Bollinger Band intersect -- as shown on the next Weekly chart of the U.S. $ Futures Index. Watch for the RSI to stay above the 50 level  (on the cash index) to confirm such a rally...as well, we'll need to see a higher high on the RSI at the 98  price level as a sign of bull conviction for any sustainable move higher.