
- FNGU is an exchange traded note that tracks 3x the daily price movements of an index of US-listed technology and consumer discretionary companies. The index is highly concentrated and equally weighted.
- FNGD is an exchange traded note that tracks 3x inverse the daily price movements of an index of high concentrated and equally weighted US-listed technology and consumer discretionary companies. The note uses derivatives to achieve its -3 exposure.
They are both highly risky investments and are very thinly traded.
The following 1-year daily thumbnail charts of these 10 stocks show, at a glance, where they're at relative to their respective trend, as well as 20 & 50-day moving averages, price support/resistance levels, and which ones are leaders or laggards over this time period.

These next charts show market action over the past two months, and, in particular, some hefty profit-taking that occurred during the past week(s).

The following two charts of FNGU show price action from its launch to this past Friday's close. The first chart is a daily one and the second one is a weekly.


The following two charts of FNGD show price action from its launch to this past Friday's close. The first chart is a daily one and the second one is a weekly.
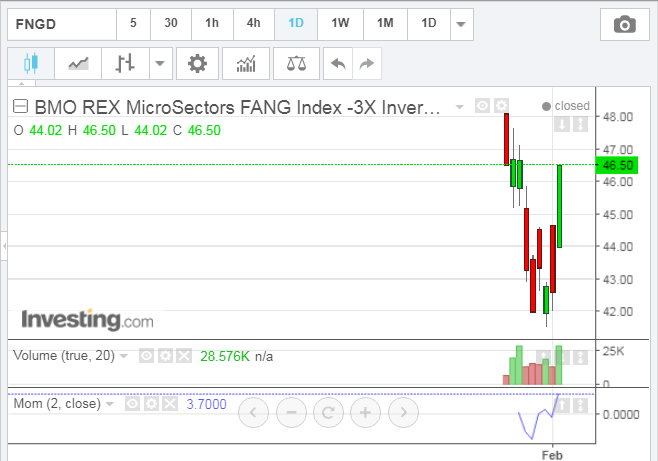

All four charts illustrate the volatility that is underlying these two ETNs, inasmuch as they're both almost back to where they started, with most of the prior week's profits wiped out in the process.
While they may be highly risky to trade, they may have some value to traders interested in any of the 10 underlying stocks. Their movement can be monitored to gauge where these stocks may be, generally, headed, as well as their current market sentiment.
At the moment, any prior upward (bullish) bias has cooled. Keep an eye on the momentum indicator shown on the daily charts. I've selected a fast-moving length of 2 days for now, until more time passes, which will allow for an implementation of the default setting of 10, to assist in this regard.