WELCOME

Welcome and thank you for visiting!

The charts, graphs and comments in my Trading Blog represent my technical analysis and observations of a variety of world markets...
* Major World Market Indices * Futures Markets * U.S. Sectors and ETFs * Commodities * U.S. Bonds * Forex

N.B.
* The content in my articles is time-sensitive. Each one shows the date and time (New York ET) that I publish them. By the time you read them, market conditions may be quite different than that which is described in my posts, and upon which my analyses are based at that time.
* My posts are also re-published by several other websites and I have no control as to when their editors do so, or for the accuracy in their editing and reproduction of my content.
* In answer to this often-asked question, please be advised that I do not post articles from other writers on my site.
* From time to time, I will add updated market information and charts to some of my articles, so it's worth checking back here occasionally for the latest analyses.

DISCLAIMER: All the information contained within my posts are my opinions only and none of it may be construed as financial or trading advice...please read my full Disclaimer at this link.

Dots

* If the dots don't connect, gather more dots until they do...or, just follow the $$$...

Convertible at Beach

Convertible at Beach

ECONOMIC EVENTS

UPCOMING (MAJOR) U.S. ECONOMIC EVENTS...

***2026***
* Wed. Sept. 16 @ 2:00 pm ET - FOMC Rate Announcement and @ 2:30 pm ET - Fed Chair Press Conference

*** CLICK HERE for link to Economic Calendars for all upcoming events.

Friday, November 04, 2022

Racists Rants Are Alive & Well At ABC's "The View"

ABC's "The View" co-hosts are well known for uttering racist rants...but this latest remark from co-host Sunny Hostin is particularly vile...where she compares white women who vote Republican to "roaches voting for Raid." ðŸ˜²

I wonder what the Jewish people would think of that remark, inasmuch as the Nazi's referred to Jews as insects who should be exterminated.

And...there's Joe Biden who accuses Republicans of stoking violence, with his own hateful remarks towards them! 

Obviously he doesn't watch and listen to what the co-hosts say on "The View"...as well as to what other Democrats say and do to people with opposing political views. 😕


GOP REPORT: FBI Whistleblower Allegations Of The Politicization Of The DOJ & FBI

House Judiciary Republicans released the following report today.

So...will there be any accountability and repercussions, if the FBI whistleblower allegations are proven to be true? 🤔


Excerpt


WBD: Another Parabolic Stock Bites The Dust

Warner Brothers Discovery, Inc. (WBD) hit a record high of 78.14 in March 2021, following a parabolic spike that began in November 2020, as shown on the following monthly chart.

It's since plunged, as is characteristic of these parabolic moves, and, as of early Friday afternoon, is trading at 10.49...a drop of 85.39%.

I don't see any evidence in its price action that it will recover any time soon, particularly since one of its subsidiaries is CNN, whose ratings are consistently well below its rival cable TV news outlets, and where a number of prime time TV hosts have, reportedly, been fired recently, as a result.


Wednesday, November 02, 2022

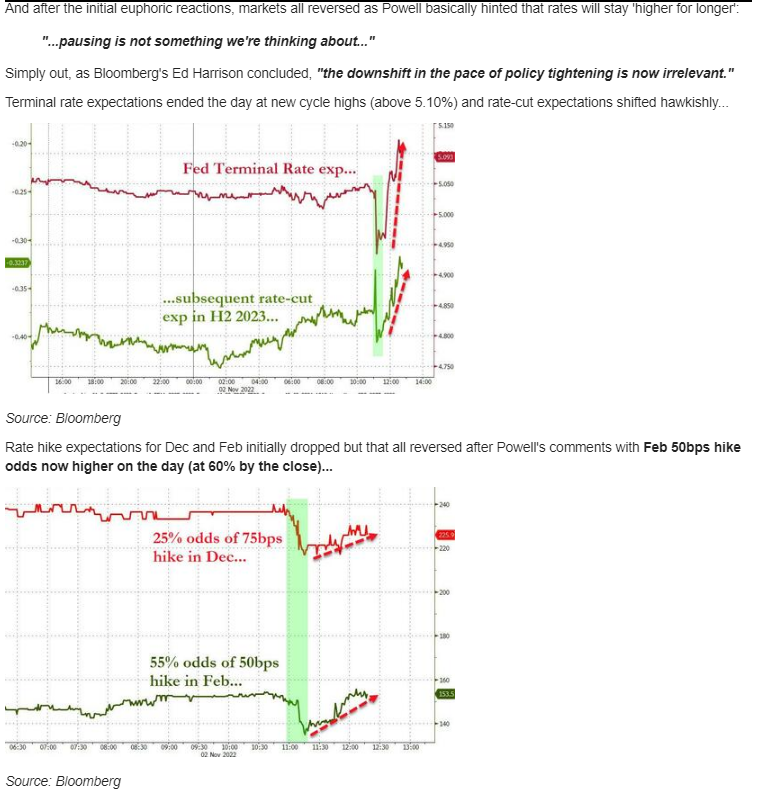
U.S. Fed: "No Pause" To Refresh

* See UPDATE below...

US Fed Chairman Jerome Powell emphasized several times during his press conference, following today's FOMC rate hike of 0.75% to 3.75%-4%, that the Fed is NOT pausing their rate hikes, as they're focused on raising rates until inflation comes back down to their target 2% rate...

"It's premature to discuss pausing and it's not something we're thinking. That's really not a conversation to be had now. We have a ways to go."

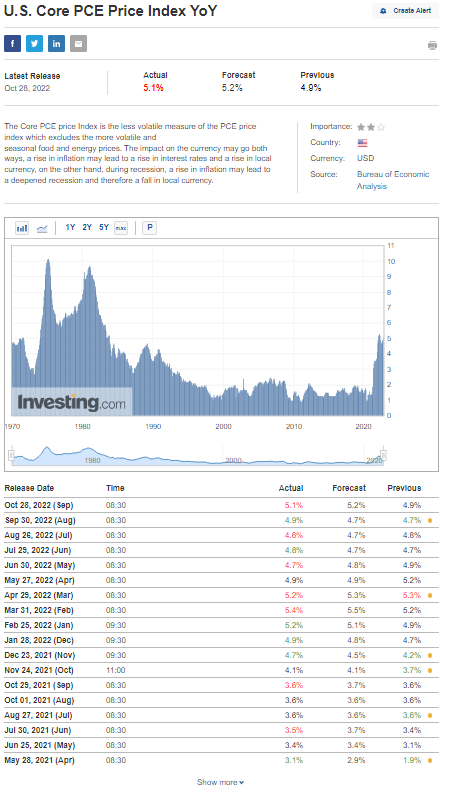
He referred to the US Core Consumer Price Index (CPI) YoY and US Core PCE Price Index YoY multiple times during the Q&A period. They are highly elevated at 40-year levels, as shown on the following graphs, and there is no hint they are falling any time soon...particularly as the costs of oil and gas show no signs of abating, and they affect the price of everything.

The SPX plunged 134.75 points from its high today of 3894.55 and closed at its low of the day at 3759.69.

So, in spite of the constant barrage of "We think the Fed's going to pause or pivot, soon..." from TV analysts and pundits, it seems that the Fed ignored all of that rhetoric, once again, to focus on their job of reducing inflation.

How many times will these talking heads cry wolf? And, how many times will the market take their bait

As long as that scenario keeps repeating itself, ad nauseam, we'll continue to see "Dead Cat Bounces" occur in the SPX bear market...as well as volatile whipsaw intraday swings.


ZeroHedge excerpt


SPX Daily

WTI Crude Oil Monthly

* UPDATE Nov. 6...

What happens when bad news is bad news?...🤔


Seeking Alpha excerpt

Seeking Alpha excerpt


Saturday, October 29, 2022

META: Tech-Wreck's Leader Of The Pack

* See UPDATES below...

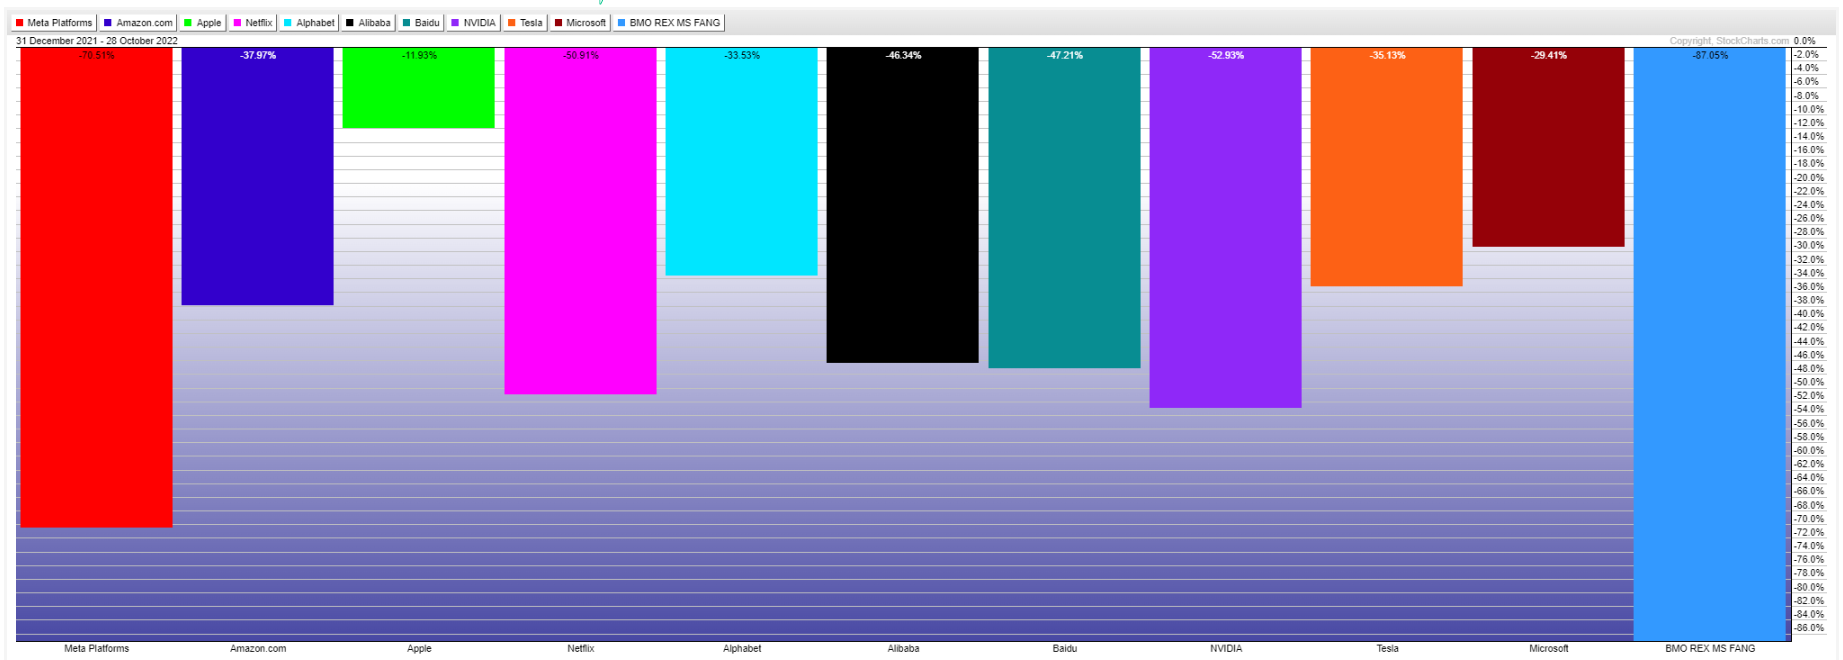
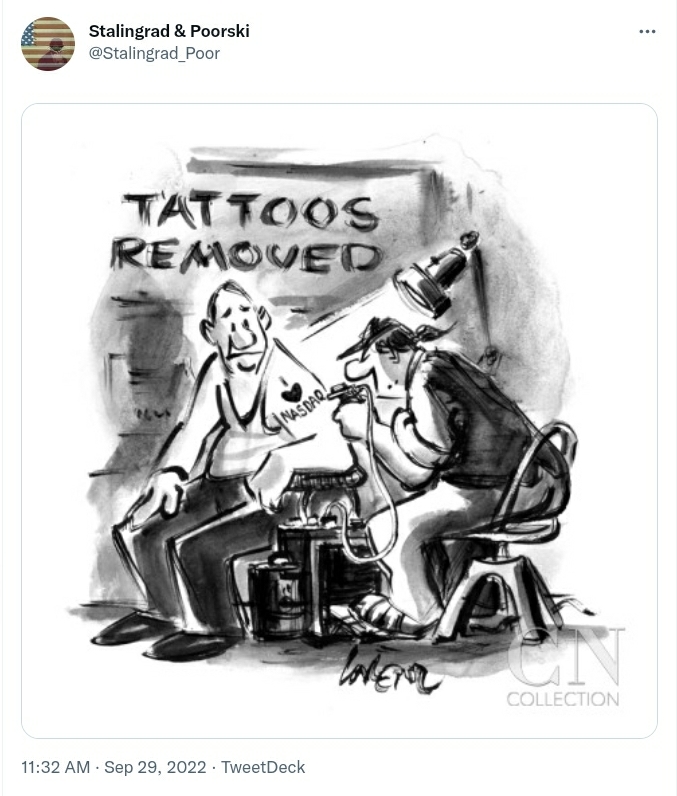
The following one-year charts and year-to-date percentages gained/lost graph show how much the 10 Technology stocks within the FNGU ETF have dropped during those periods.

META (Facebook) has lost the most, percentage-wise (70.51%), so far this year, followed by:

  • NVDA (52.93%),
  • NFLX (50.91),
  • BIDU (47.21%),
  • BABA (46.34%),
  • AMZN (37.97%),
  • TSLA (35.13%),
  • GOOGL (33.53%),
  • MSFT (29.41%), and 
  • AAPL (11.93%).

FNGU has, itself, lost 87.05% this year.

Further weakness in META could drag these stocks lower...one to watch...along with the VXN:NDX ratio, as described in my post of October 18.

One-year Daily Charts

Year-to-date Percentages Gained/Lost graph

META has been running in circles...and is back in 2016 territory...


P.S. Is AMZN next? Note the parabolic rise...usually followed by a similar plunge.


* UPDATE Oct. 31...

Oh my! 😲

No wonder the Biden administration does NOT want Republicans taking control of the House and Senate in the midterm elections...who will, surely, add this to their growing list of intended investigations!


* UPDATE Nov. 1...

Some interesting statistics...(N.B. TWTR was delisted from the NYSE on November 28, since it was privatized, following its sale to Elon Musk)...


* UPDATE Nov. 4...

Who wouldn't like to a fly on the wall during these upcoming depositions?

Things should get "interesting" as Americans finally get the transparency, to which they are fully entitled.

* UPDATE Nov. 6...

With META reportedly poised to announce thousands of job layoffs sometime this week, it should be a wild week in markets with all eyes on Tuesday's midterm election results...isn't it interesting that they're waiting until after that to announce! 🤔


ZeroHedge excerpt

ZeroHedge excerpt

* UPDATE Dec. 3...

More information on Elon Musk, his private purchase of Twitter, and his actions to make public Twitter's shocking suppression of free speech under its former executives and employees can be found here.


Monday, October 24, 2022

Chaos In China's Hang Seng Index

* See UPDATE below...

In my post of March 14, I described a scenario where a drop and hold below 20,000 on China's Hang Seng Index (HK50) could see it plunge to 16,000, or lower.

It, subsequently, swirled around that level, finally closing below at the end of August, as shown on the following monthly chart.

It has since plummeted and closed on Monday at 15,180.69...losing 6.3% on the day.

Sellers are in control, as downside volatility is increasing.

Should price remain below 20,000, it could easily drop to 12,000, or even lower to 8,000.

Monday was a bad day for all Chinese indices.

There are numerous major issues, with which China is grappling, including their property market, technology sector, zero COVID-19 policies, inflation, currency, support for Russia in their war with Ukraine, etc.,...none of which can be readily resolved...and none of which would be attractive to new foreign investment.

The following article describes some of those.

N.B. Further China weakness may drag other world markets (or their financial institutions) lower, if they are already heavily invested, directly or indirectly, in any of those markets. 

So, bear in mind the remarks I made in my post of October 22.

* UPDATE Oct. 29...

The Hang Seng Index lost further ground this past week...opening below 16,000 and closing at 14,863.06.

It closed below the bottom of a long-term uptrending channel the prior week around the 16,500 level, as shown on the following monthly chart.

Any sustainable rally over the coming weeks will need to see it retake and hold above, firstly, 16,000, then 16,500...for a possible retest of 20,000

Otherwise, it could easily plunge to 12,000, or, even, 8,000.

Correspondingly, the Shanghai Index (SSEC) is caught in a narrow band within a large matrix (between 3,000 and 2,840), as shown on the following monthly chart.

It's had difficulty remaining above 3,550 since January 2007, which is a formidable long-term resistance level (and part of a significant future apex within this matrix...forming roughly in April 2029).

Failure to convincingly retake and hold above 3,000, could see it plunge to 2,500, or, even, 2,000.

For now, China weakness continues.

* UPDATE Nov. 27...

From the following report, it's clear that the China boom of the 1990s, then the 2000s, has been badly damaged, as shown on the monthly chart of the Hang Seng Index (HK50) below.

HK50 has failed to continue with the upward trajectory and pace of those decades, evident by the break and plunge below the longterm rising channel this year.

Furthermore, HK50 has struggled to remain and gather strength above 20,000 for the past 16 years.

I find it hard to believe that China will regain its former glory any time soon, if ever, (a) for the reasons cited in the report, (b) for the aforementioned charting reasons, as well as, (c) the fact that world countries are moving away from their previous reliance on cheap Chinese goods in favour of domestic product development and production.

As such, I anticipate that HK50 will be locked in a large sideways trading range for some time -- complete with volatile whipsaw price action -- between 12,000 and 20,000.