WELCOME

Welcome and thank you for visiting!

The charts, graphs and comments in my Trading Blog represent my technical analysis and observations of a variety of world markets...
* Major World Market Indices * Futures Markets * U.S. Sectors and ETFs * Commodities * U.S. Bonds * Forex

N.B.
* The content in my articles is time-sensitive. Each one shows the date and time (New York ET) that I publish them. By the time you read them, market conditions may be quite different than that which is described in my posts, and upon which my analyses are based at that time.
* My posts are also re-published by several other websites and I have no control as to when their editors do so, or for the accuracy in their editing and reproduction of my content.
* In answer to this often-asked question, please be advised that I do not post articles from other writers on my site.
* From time to time, I will add updated market information and charts to some of my articles, so it's worth checking back here occasionally for the latest analyses.

DISCLAIMER: All the information contained within my posts are my opinions only and none of it may be construed as financial or trading advice...please read my full Disclaimer at this link.

Dots

* If the dots don't connect, gather more dots until they do...or, just follow the $$$...

Loyalty

Loyalty

ECONOMIC EVENTS

 UPCOMING (MAJOR) U.S. ECONOMIC EVENTS...

***2024***
* Fri. April 5 @ 8:30 am ET - Employment Data
* Wed. April 10 @ 2:00 pm ET - FOMC Meeting Minutes
* Wed. April 17 @ 2:00 pm ET - Beige Book Report
* Wed. May 1 @ 2:00 pm ET - FOMC Rate Announcement + Forecasts and @ 2:30 pm ET - Fed Chair Press Conference

*** CLICK HERE for link to Economic Calendars for all upcoming events.

Tuesday, October 21, 2014

What do the SPX & WORLD Indices Forecast?

The following four 3-Year Daily charts show the relative strength/weakness of the SPX compared with the WORLD Index.

Chart #1 shows a fairly steady climb of the SPX during the past three years. Recent action in October has put in a lower low and broken the uptrend on this daily timeframe. Lower lows have also been made in all three indicators (RSI, MACD & Stochastics)...hinting of further weakness ahead.
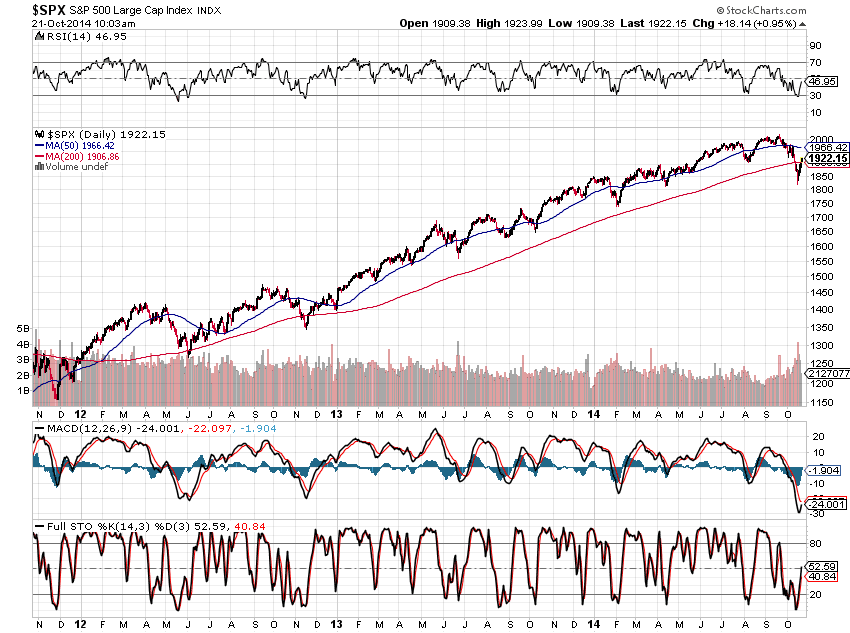
CHART #1

Chart #2 shows a more difficult climb of the WORLD Index once it broke above major resistance in January of 2013. This market topped out in July of this year, lost all of its 2014 gains, along with much of its 2013 gains, and hasn't yet recovered.

CHART #2

It's hard to imagine that the SPX will operate under smooth, believable (realistic), and sustainable bullish conditions during the balance of this year and into next if conditions continue to deteriorate in the WORLD Index.

In this regard, watch for any strengthening of the WORLD Index versus the SPX over the coming days/weeks...or continued weakness...as depicted on the following two ratio charts of SPX:WORLD and WORLD:SPX.

No confirmation of a turnaround is indicated yet for the WORLD Index (see Chart #4) as the RSI and Stochastics Indicators are still below the 50% level; however, the MACD has crossed up and the MACD Histogram is above zero...hinting of a possible slowdown in its decline.

CHART #3

CHART #4