WELCOME

Welcome and thank you for visiting!

The charts, graphs and comments in my Trading Blog represent my technical analysis and observations of a variety of world markets...
* Major World Market Indices * Futures Markets * U.S. Sectors and ETFs * Commodities * U.S. Bonds * Forex

N.B.
* The content in my articles is time-sensitive. Each one shows the date and time (New York ET) that I publish them. By the time you read them, market conditions may be quite different than that which is described in my posts, and upon which my analyses are based at that time.
* My posts are also re-published by several other websites and I have no control as to when their editors do so, or for the accuracy in their editing and reproduction of my content.
* In answer to this often-asked question, please be advised that I do not post articles from other writers on my site.
* From time to time, I will add updated market information and charts to some of my articles, so it's worth checking back here occasionally for the latest analyses.

DISCLAIMER: All the information contained within my posts are my opinions only and none of it may be construed as financial or trading advice...please read my full Disclaimer at this link.

Dots

* If the dots don't connect, gather more dots until they do...or, just follow the $$$...

Paris Cafe

Paris Cafe

ECONOMIC EVENTS

UPCOMING (MAJOR) U.S. ECONOMIC EVENTS...

***2026***
* Wed. July 29 @ 2:00 pm ET - FOMC Rate Announcement + Forecasts and @ 2:30 pm ET - Fed Chair Press Conference

*** CLICK HERE for link to Economic Calendars for all upcoming events.

Showing posts with label Annual Market Forecasts. Show all posts

Tuesday, December 26, 2023

2024 MARKET FORECAST: 'Black Swan Event' In 2024 It Is Then...

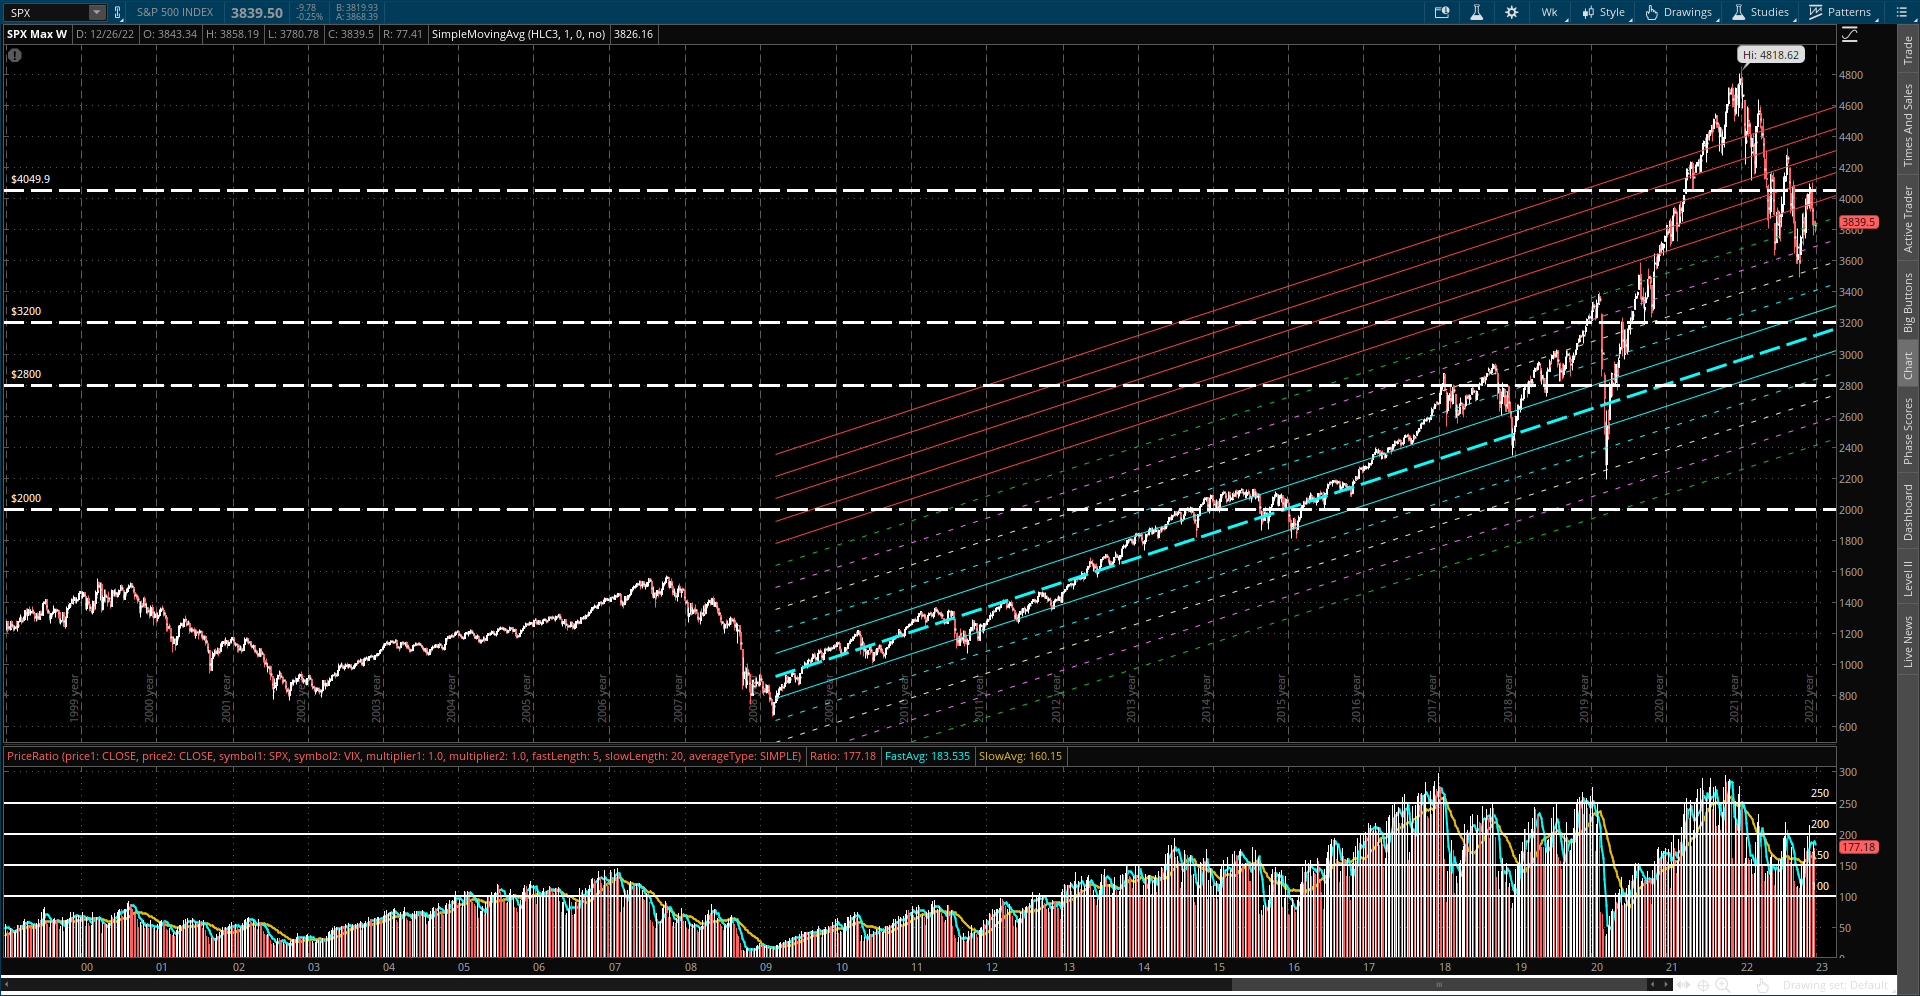
Perhaps this CBS news reporter's prediction of a 'Black Swan Event' for 2024 is not so far off...either when it comes to U.S. national security, or in the stock markets...especially when one considers the reluctance of traders/investors to convincingly push markets above the December 2021 high for the past two years, as shown on the following monthly S&P 500 Index (SPX) chart.


Perhaps such reluctance stems from Joe Biden's epic multiple failures as a leader since he became President in January of 2021, about which I've written extensively...some of these include:


CONCLUSIONS:

As I hypothesized in my 2023 Market Forecast, and, as long as Joe Biden remains President, I think we'll see more whipsaw, volatile moves occur in all markets in 2024, until such a 'Black Swan event' does occur...particularly since it's a presidential election year and each one has become more contentious and controversial. 

Furthermore, this article highlights the extreme importance of this election, inasmuch as global instability is at stake. 

N.B. By the way, add to this, the damning Special Counsel's conclusions and report (released to the public on February 8, 2024) -- where he highlighted President Biden's mental unfitness to stand trial for his willful and unlawful retention and disclosure of classified materials when he was a private citizen during his post Vice-Presidency -- and you have a recipe for a global disaster as long as he remains President.

Any push to new highs may be met with a swift retreat to new lows...possibly to retest 3200, or lower.

HAPPY NEW YEAR AND BEST OF LUCK IN 2024!

* UPDATE March 21, 2024...

It seems like market players have refused to entirely release their grip, so far, on the 'greed' and 'delusion' segment of the Perpetual Stock Market Cycle, as noted in the following monthly comparison chart of the SPX and BITCOIN.

Keep an eye on the near-vertical rise of both of these...which one will topple first?


And, with Democrats continuing to plow forward with their far-left economically-destructive Green New Deal, about which I warned 5 years ago in this post, it's only a matter of time before either one, or both, topple from their lofty heights.


N.B. Even politically-centrist Elon Musk's views are now accused of being right-wing by these extreme far-left Democrats, as described in this article...common sense is foreign to them.

And, the (sensible) meek shall regain control...eventually...


😏

P.S. For more examples of potential Black Swan events, check out my article here.


Monday, January 02, 2023

2023 Market Forecast

My 2021 Market Wrap-Up and 2022 Forecast can be found at this link.

I speculated that 2022:

  • would see higher volatility, lower volumes, lower trend sustainability, longer periods of consolidation, lower expectations, and lower certainty, overall,
  • would be hung over with higher (persistent) inflation, COVID-19 variants and accompanying economic disruptions, increased interest rates, a changing political landscape, increasing national and international security concerns, and a skyrocketing national debt,
  • may feel like market makers and movers/shakers have you "on hold" at times, and
  • would bring surprises, some quite shocking (to markets) if/when they become common knowledge.

In conclusion, I suggested that traders/investors look for more stable and valuable sectors and stocks, commodities, bonds, and currencies which, potentially, may act as a safer hedge against the headwinds (and, as yet, unrevealed shocking surprises) described above.

In fact, 2022 ushered in all of these events.

Large-scale whipsaw market action in 2022 is evident on the following weekly, monthly, quarterly and yearly charts of the S&P 500 Index (SPX).

My 2022 Market Wrap-Up post describes this more fully...2022 was a year of:

  • a slow, choppy decline,
  • day-to-day or week-to-week erratic and non-directional trading, with price bouncing back and forth between Buyers and Sellers, like a yo-yo, and
  • gains on either the long or short side being short-lived.

SPX Weekly

SPX Monthly

SPX Quarterly

SPX Yearly

Of the following graphs of the U.S. Major Indices and Major Sectors showing percentages gained/lost in 2022, the only sector that made any significant gains was the Energy sector (which gained 64.32%). All of the Major Indices lost, with the Nasdaq Composite and Nasdaq 100 Indices losing the most, while the Dow Utilities lost the least.

Percentages Gained/Lost Graph of U.S. Major Indices

Percentages Gained/Lost Graph of U.S. Major Sectors

The U.S. Fed has continued to aggressively raise interest rates, which now sit at 4.25 to 4.50%. Its 2023 target rate is 5.1%...its 2024 target rate is 4.1%...and its 2025 target rate is 3.1%.

The COVID-19 virus has continued to play havoc with supply chains and world markets, especially, parabolic one-hit COVID-era wonders...as noted in these posts. China is struggling with a massive increase in the virus, which is causing great harm to its population, and has been having a negative effect on its Shanghai Index and Hang Seng Index.

President Joe Biden's economic agenda of out-of-control spending of trillions of dollars has shot up the U.S. National Debt to almost $31.5 Trillion, making every taxpayer responsible for $246,866+...and increasing the threat to National Security...as well as making life miserable for Fed Chairman Jerome Powell. Biden shows no signs of changing any of his extreme far-left (socialist) policies or agenda, which will lead to his eventual political downfall...he can kiss his 2024 chances of re-election good-bye!

Russia invaded Ukraine on February 24, 2022 in a major escalation of the Russo-Ukrainian War, which began in 2014...and has caused thousands of deaths on both sides, cost the U.S. and NATO countries billions of dollars, and has caused Europe's largest refugee crisis since World War II. As a result, Crude Oil prices shot up and will remain elevated, or climb higher, as long as President Biden and other world leaders continue their relentless war on fossil fuels in favour of pushing their climate-change theories and ESG agenda.

Record-high illegal border crossings, drug smuggling, and human trafficking operations along the southern border of the U.S. (approx. 5 million in the past 2 years from 161 countries), along with record-high violent crime rates and large-scale "looting swarms" of businesses all across America, are threatening to bankrupt many small businesses. If this continues unabated, along with rising interest rates, we'll see more and more layoffs this year in a variety of small and large companies (raising the unemployment rate), as well as higher prices of goods and services...leading to a recession and/or stagflation.

U.S. and foreign Banks are under pressure, as shown on the following monthly chartgrid, as interest rates rise and as businesses begin to default on loans and credit card debt repayments stop. Furthermore, if any of these banks are involved in crypto trading, as described below, we'll likely see further losses, if crypto contagion becomes widespread in 2023...etc.

Banks Monthly

The U.S. Dollar remains the favoured of world currencies, as shown on the following percentages gained/lost graph in 2022.

Percentages Gained/Lost Graph of Currencies

However, it has lost ground during the latter half of 2022, as other world currencies moved back toward their long-term "median" of their respective regression channels, as shown on the following monthly chartgrid.

Forex Monthly

2/5/10/30-Year U.S. Bonds peaked in 2020 and have dropped ever since, as shown on the following monthly chartgrid. However, they have stabilized somewhat just below their respective long-term regression channels. I think investors will start buying up Bonds in 2023, as crypto markets continue to fail, bank lending tightens, and equities continue to drop.

Bonds Monthly

The crypto-currency markets were roiled by the Sam Bankman-Fried scandal involving FTX, et al, as described here. A related crypto-currency, Bitcoin, lost 64.07% in 2022, as shown on the Currencies graph above. No doubt, there will be more crypto contagion as more graft (corruption, deceit and fraud) is uncovered, along with reckless "investments"...and we may eventually see Bitcoin hit 10,000, or lower to, possibly, zero, as shown on the monthly chart below.

Bitcoin Monthly

The following Pivot Points were calculated from the high/low/close of the 2022 candle, shown on the Yearly SPX chart above.

It shows the SPX target resistance and support levels for 2023. Note that S1 is close to the 3200 level, mentioned in my post of December 21. I think that level will be hit sometime in 2023...possibly the first half.

Pivot Point Calculations for SPX for 2023

In conclusion, with all the above negative factors weighing on traders/investors, it seems that it would be an epic climb for the SPX to rally to even its R1 level around 4600, let alone to new record highs in 2023.

Rather, I think we'll see more of the same that transpired in 2022, as I described in my opening segment above, with choppy, whipsaw prices sliding down to 3200, or lower...particularly, as/if companies forecast lower earnings growth in their upcoming quarterly releases in 2023.

As in 2022, "look for more stable and valuable sectors and stocks, commodities, bonds, and currencies which, potentially, may act as a safer hedge against the headwinds (and, as yet, unrevealed shocking surprises...yes, more await), as described above."

Happy New Year and best of luck in 2023!

* UPDATE Jan. 16, 2023...

Well, that didn't take long...the first shocking surprise of 2023 has arisen...Joe Biden's Classified Document Dilemma. We'll see if there's any fallout in the markets, as a result, in due course.

* UPDATE Jan. 17...

From this Wall Street Journal article..."Big banks may need to be broken into smaller pieces if they become too big to manage and are unable to fix significant regulatory lapses, a top federal banking regulator said in a warning shot across Wall Street on Tuesday." 

We'll see if this becomes another shocking surprise of 2023...see my above-mentioned comments regarding U.S. and foreign Banks on rising interest rates, loan and credit card defaults, crypto contagion, etc.

* UPDATE Feb. 5...

Please see my post of December 29, 2019 (SPX: What's In Store For The 2020s & 2030s?) for additional relevant information.

* UPDATE Feb. 7...

When consumers start defaulting on their credit debt (loans, car payments, mortgage payments, student loan payments, etc.), then the fireworks will begin and equity markets will tank.

P.S. Subprime auto loan defaults are beginning, as described in this Zerohedge article (Feb. 27).


Friday, December 23, 2022

2022 Market Wrap-Up: 'Like Watching Paint Dry'

The May 2022 'long-legged doji' foretold how the second half of the year would unfold on the S&P 500 Index (SPX)...with choppy, volatile indecision.

As shown on the following monthly chart, the price has, essentially, traded sideways in a large trading zone, between 3500 and 4300.

It's bounced back and forth between Buyers and Sellers, like a yo-yo.

As it's turned out, any gains, either on the long or the short side, have been short-lived...much like the first half of 2022 was.

Day-to-day or week-to-week trading for 2022 has been erratic and non-directional...and about as interesting as 'watching paint dry.'

Unless you took profits during the December 2021 candle -- which followed November's bearish 'shooting star' (which wasn't confirmed until January's 'bearish engulfing' candle) -- and, either, shorted the markets and held, or, simply stayed out, you were caught up in this slow slip downwards, dominated by choppy large-scale sideways consolidations.

As I mentioned in my post of December 21, we may see a fourth 'candy cane' form in January 2023, with a price target of 3200...if Sellers remain in control.

We'll see what happens.

I hope to post my Annual Forecast for the New Year in the next few days, so stay tuned. As a reminder, my 2021 Market Wrap-Up & 2022 Forecast can be read here.


Friday, October 14, 2022

SPX 2022: Buy Or Sell Or Stay Out?

* See UPDATES below...

The following excerpts are taken from my 2021 Market Wrap-Up and 2022 Forecast (much of which has transpired, so far, this year).


Judging from the volatile rollercoaster action in markets this year, it seems that traders would have been better off, if they had:

  1. liquidated their equity positions,
  2. then just stayed with cash ($USD),
  3. then gone on vacation,
  4. then waited for capitulation before jumping back in, as I've described here, here, here and here,
  5. AFTER the Fed has stopped raising interest rates.

Instead, we've witnessed a dog's breakfast of volatility that will likely continue, due to the market's penchant for trading on "greed and fear" and "rumour and news" tactics.

SPX Monthly

SPX Daily

How markets closed the week (percentages gained/lost this week)...

US Major Indices: One-Week % Gained/Lost

US Major Sectors: One-Week % Gained/Lost

World Currencies: One-Week % Gained/Lost

And this roundup for the week from ZeroHedge...

* UPDATE Oct. 15...

It looks like markets have more downside in store over the coming weeks and months...plus a lot of volatility...


ZeroHedge excerpt


ZeroHedge excerpt

* UPDATE Oct. 19...

The following summary is taken from today's Beige Book report...the yellow highlights are mine.

The overall themes in the 12 Federal Reserve Districts are pessimismweakening demand, tight labour markets, and elevated prices.

Any way you look at things, if wages keep rising, this will contribute to higher inflation (in spite of potential lower prices) and lower returns for companies and their shareholders...and further volatility in the markets.

So, all in all, I'd say that today's report does not paint a rosy picture, for the foreseeable future.


Sunday, May 01, 2022

Remedy For Fed-Fuelled Wall St. Gluttony...Purging

* See UPDATES below...

What is Wall Street to do after gorging on cheap money, supplied in abundance by the U.S. Federal Reserve ever since they slammed the brakes on heavy losses caused by the 2008/09 financial crisis?

Purge, of course...as evidenced by the following 10 major technology stocks...all of which are currently in the FNGU ETN basket of stocks.

Judging by the massive haemorrhaging that has occurred this year, it seems that the respective values of these stocks were wildly over-inflated by pure speculation, based solely on cheap money supply...not on the actual value of these stocks and their products/services.

You'd think that the Fed would have learned their lesson by now and not fuelled another stock market bubble, as they've done in the past.

There's no telling where these and other stocks will end up over the next months, but with the Fed pulling the plug on their latest (failed) money-printing experiment, it appears that consumers are finally dictating what their priorities are...and spending their ever-shrinking dollars on basic necessities, and not the 'latest and greatest shiny baubles.'

As long as inflation continues to rage and the global supply chain keeps on sputtering and breaking, with talk of impending recession swirling in the mix, I doubt we'll see equity markets race to new highs over the next several years. Instead, volatility will continue to remain at the forefront of short-lived plunges and spikes in both directions...and indecision will plague market players.

Therefore, I still stand by my market assessment described in my post of March 8.

The following one-year charts of the 10 tech stocks that are within the FNGU ETN basket exemplify the volatility that has plagued equity markets since the beginning of the year, and, in some cases, for a year, or more.

The following graph shows the percentages that these stocks have lost year-to-date.

To add a little more perspective on a couple of these stocks, the following charts compare longer-term monthly price action of NFLX with FNGU and AMZN with FNGU.

I'd say that they, and especially FNGU, portray the gluttony and purging described above.


Some additional details regarding AMZN's poor performance are provided in the following ZeroHedge article.

And, there's this ZeroHedge market analysis...

As an aside, another example of this gluttony and purge scenario is the ARK Innovation ETF, ARKK (containing 141 stocks), as shown on the following monthly chart comparing it to FNGU. You can see that it has traded in lock-step with FNGU over the years.

ZeroHedge has provided a bit more 'colour commentary' on this ETF, as follows.

P.S. To repeat what I said in March..."Best of luck...it's crazy 'out there'...and rumours are flying everywhere!" 😏

* UPDATE May 4...

The Federal Reserve raised interest rates by 0.50% today. 

This tweet sums up where we're at, thanks to the Fed's overly-accommodative policies during the past years...too little, too late...they are a joke.

* UPDATE May 7...

I'm at a loss for words...which doesn't happen very often...

* UPDATE May 19...

The Fed's loose monetary policies have forced people to invest their savings into riskier assets that they wouldn't normally have taken in order to generate a real return...eventually creating bubbles which pop...

* UPDATE July 19...

Leverage, expansion and liquidity are favoured policies of the U.S. Fed...but at what cost? 😕

* UPDATE July 20...

Place the blame for inflation on the Fed and the U.S. government...where it belongs...


ZeroHedge excerpt

* UPDATE Sept. 21...

More pain ahead as the Fed raised their rates another 0.75% today and signalled higher rates for longer...markets dumped and the US Dollar spiked on the news...


ZeroHedge excerpt

* UPDATE Sept. 23...

More confirmation of pain ahead...for consumers, businesses, and markets...as the purging continues...


ZeroHedge excerpt

The SPX has plunged over the past two weeks and is close to retesting its 2022 low of 3636.82, or lower...and Goldman Sachs has a new crash target of 3150.

* N.B. For more Fed UPDATES click this link.