WELCOME

Welcome and thank you for visiting!

The charts, graphs and comments in my Trading Blog represent my technical analysis and observations of a variety of world markets...
* Major World Market Indices * Futures Markets * U.S. Sectors and ETFs * Commodities * U.S. Bonds * Forex

N.B.
* The content in my articles is time-sensitive. Each one shows the date and time (New York ET) that I publish them. By the time you read them, market conditions may be quite different than that which is described in my posts, and upon which my analyses are based at that time.
* My posts are also re-published by several other websites and I have no control as to when their editors do so, or for the accuracy in their editing and reproduction of my content.
* In answer to this often-asked question, please be advised that I do not post articles from other writers on my site.
* From time to time, I will add updated market information and charts to some of my articles, so it's worth checking back here occasionally for the latest analyses.

DISCLAIMER: All the information contained within my posts are my opinions only and none of it may be construed as financial or trading advice...please read my full Disclaimer at this link.

Dots

* If the dots don't connect, gather more dots until they do...or, just follow the $$$...

Beach Drinks

Beach Drinks

ECONOMIC EVENTS

UPCOMING (MAJOR) U.S. ECONOMIC EVENTS...

***2026***
* Wed. June 17 @ 2:00 pm ET - FOMC Rate Announcement + Forecasts and @ 2:30 pm ET - Fed Chair Press Conference

*** CLICK HERE for link to Economic Calendars for all upcoming events.

Showing posts with label Parabolic Rise. Show all posts

Friday, June 05, 2026

BITCOIN: Chaos

Bitcoin in a nutshell...CHAOS...over and over again.

Not for the faint of heart! 🤢


UPDATE:

Bitcoin's extreme volatility renders it unsuitable for normal technical analysis, as has been done in the following report.

IMHO it's simply an overhyped kleptocurrency...as are the rest of these cryptocurrencies.


Monday, April 21, 2025

GOLD: The Next Parabolic Bubble?

We'll see.

If we do see a blow-off in price at some point soon, perhaps 3000 will hold as support, since that was a technical upside target within the confluence zone of two major long-term Fibonacci levels, as per my post of December 6, 2022.

GOLD finally hit 3000 on March 11 of this year, for a gain of 68% -- and has nearly reached 3500 -- as shown on the following monthly chart.

P.S. Price briefly pierced through 3500 on April 22 before dropping back below during intraday trading.

GOLD Monthly chart

* UPDATE October 24...

So, 3000 held...and GOLD has been on an upward tear ever since.

As noted on the following monthly chart, it nearly hit 4400, where there has been some profit taking.

Barring any major negative global influences, there is no overhead technical resistance to stop its climb towards 5000.

GOLD Monthly chart

* UPDATE January 26, 2026...

No bubble burst yet...GOLD is still on a tear as it crossed above 5000 late last week, as shown on the following monthly chart.

There is no overhead resistance to stop this unprecedented massive accumulation, so, we'll see if it reaches its next big round number of 6000.

The most recent support level is 4400, denoted on the following daily chart. If 5000 is broken and held to the downside, we may see a retest of 4400 at some point, or somewhere around 4700.

Otherwise, momentum is with the bulls.

GOLD Monthly chart

GOLD Daily chart


Tuesday, December 10, 2024

BITCOIN: Floating On Air

A simple observation on Bitcoin reveals that it's floating on air following its parabolic breakout above 70,000 during the week of November 4, as shown on the following weekly chart.

A break and hold below 90,000 could see a retest of major support at 70,000, or, at least, a pullback from its high of 103,990 to around 86,995 (50% of the difference between 103,990 & 70,000 = 16,995) where we may see it consolidate for awhile before, either, resuming its upward movement or losing steam to fall to 70,000, or lower.

The one certainty or constant characteristic of this 'wild-west-like' trading instrument is that it has always been dominated by wild and extreme, volatile swings in both directions. 

I don't see that chaotic price action changing or moderating anytime soon...and is, thus, predictable.


Friday, May 19, 2023

U.S. DEBT CEILING: Biden Had 100 Days To Negotiate But Rebuffed Republicans

N.B. Inflation was 1.4%
when Trump left office
on Jan. 20, 2021
* See UPDATE below...

Insofar as the proverbial "buck stops at the top" saying dictates, this would then apply to U.S. President Joe Biden, who, for 100 days, refused to negotiate with Republican House Speaker Kevin McCarthy regarding the upcoming expiration of the infamous Debt Ceiling and its extension with respect to his proposed multi-trillion dollar budget.

So, here we are, with the presumed expiry date of June 1st fast approaching and no deal has been reached.

The ball is in Joe Biden's court, inasmuch as a majority of the House approved the Republican's bill which raises the debt ceiling (albeit much less than what Biden wanted), with alterations to his budget.

Democrats have not prepared a counter-plan of their own, and neither has President Biden.

So far, Biden has refused to budge on their offer, and talks have now broken down today...with no deal reached...and the President is nowhere in sight, but chose, instead to attend a G7 meeting in Japan.

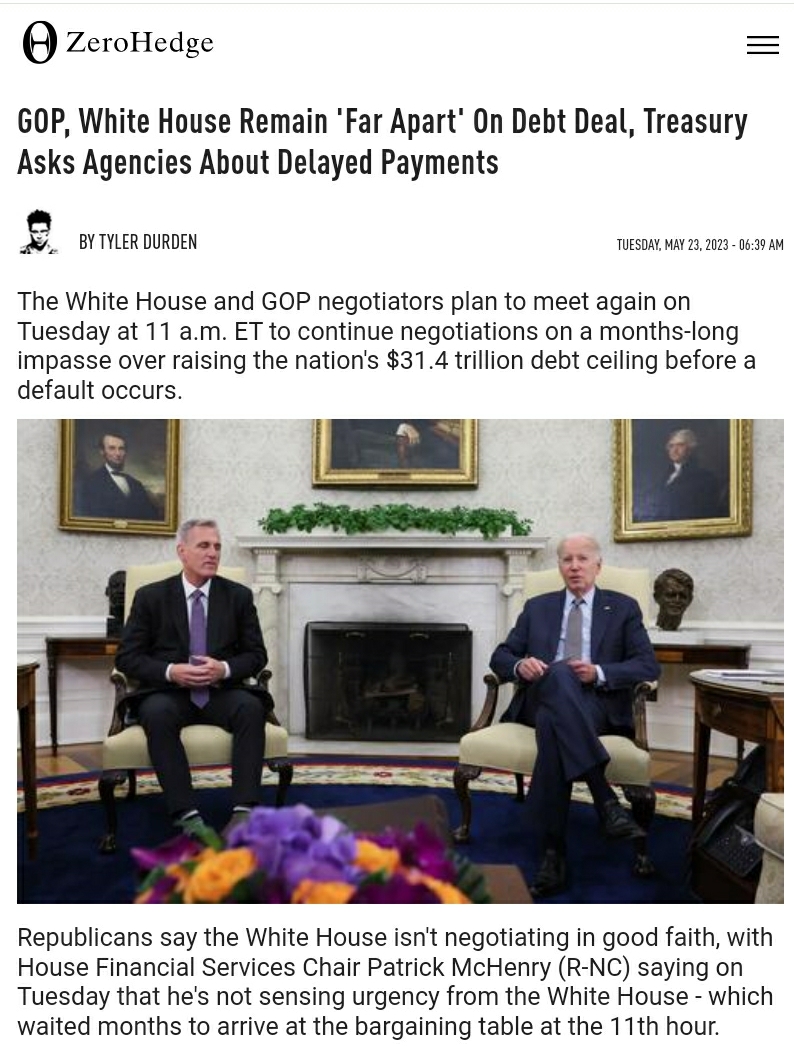
The following article provides further details on today's failed negotiations and walk-out.

As you can see from the following graphic, the rise of America's Debt Ceiling has become parabolic and cannot be sustained, especially with President Biden's budget proposal to raise it by another $5.8 Trillion this year!

And, with a possible recession looming in the midst of, still, high inflation (in spite of higher interest rates, courtesy of the Fed), and bankruptcies already on the rise (stressing banks), it behoves Biden to justify (to the American public) exploding the debt even higher.

Reckless Federal Reserve monetary policies, as well as the Biden Administration's out-of-control fiscal spending and radical energy policies, have led to high inflation (9.06% in June 2022) and higher U.S. debt

N.B. Inflation was 1.4% when President Trump left office on January 20, 2021.

Where we go from here is anybody's guess...market players are currently undecided, as well, inasmuch as the SPX is still stuck in its large sideways "Chaos Zone," that I described in my post of March 31, after briefly piercing above its upper edge.

At the moment, price is currently sitting just beneath its channel median, as shown on the following monthly chart.

Failure of the SPX to break and hold above this median and its upper "Chaos Zone," around 4200, could send it back to its lower edge at 3750, or lower to retest 3500, or even 3000.

So, I'll leave you with this little gem...the sum total of Joe's presidency...in his own words...

Seriously, it's no joke! 😕

* UPDATE May 23...

It appears as though President Biden does not take the debt ceiling negotiations seriously and is being seen as negotiating in bad faith...suggesting that there may be some question about the actual default date that has, up to now, been proclaimed as fact by his Treasury Secretary, as described in the following report.

Markets have been fairly subdued and directionless of late, as described above, but just how long investors' patience with this political charade will last is anybody's guess. 

The longer this drags on, there is a greater chance we'll see markets drift lower, until they reach a critical velocity that produces a plunge below major support (3750 on the SPX).


Tuesday, November 08, 2022

"Klepto" Cryptomania Crashes

* See UPDATES below...

If market players ( e.g., SoftBank, BlackRock, and many others) were addicted to insane risk, they would have invested in crypto currencies and exchanges...which are in absolute freefall today.

It's just a matter of time before these klepto ponzi schemes hit rock bottom...what a hot mess!


ZeroHedge excerpt

ZeroHedge excerpt


N.B. ⬆️⬆️⬆️


FTX Token (FTT/USD)


* UPDATE Nov. 9...

Things could get very ugly for FTX's Sam Bankman-Fried...what about facing an investigation for fraud, for one thing...

Friday, November 04, 2022

WBD: Another Parabolic Stock Bites The Dust

Warner Brothers Discovery, Inc. (WBD) hit a record high of 78.14 in March 2021, following a parabolic spike that began in November 2020, as shown on the following monthly chart.

It's since plunged, as is characteristic of these parabolic moves, and, as of early Friday afternoon, is trading at 10.49...a drop of 85.39%.

I don't see any evidence in its price action that it will recover any time soon, particularly since one of its subsidiaries is CNN, whose ratings are consistently well below its rival cable TV news outlets, and where a number of prime time TV hosts have, reportedly, been fired recently, as a result.


Saturday, October 29, 2022

META: Tech-Wreck's Leader Of The Pack

* See UPDATES below...

The following one-year charts and year-to-date percentages gained/lost graph show how much the 10 Technology stocks within the FNGU ETF have dropped during those periods.

META (Facebook) has lost the most, percentage-wise (70.51%), so far this year, followed by:

  • NVDA (52.93%),
  • NFLX (50.91),
  • BIDU (47.21%),
  • BABA (46.34%),
  • AMZN (37.97%),
  • TSLA (35.13%),
  • GOOGL (33.53%),
  • MSFT (29.41%), and 
  • AAPL (11.93%).

FNGU has, itself, lost 87.05% this year.

Further weakness in META could drag these stocks lower...one to watch...along with the VXN:NDX ratio, as described in my post of October 18.

One-year Daily Charts

Year-to-date Percentages Gained/Lost graph

META has been running in circles...and is back in 2016 territory...


P.S. Is AMZN next? Note the parabolic rise...usually followed by a similar plunge.


* UPDATE Oct. 31...

Oh my! 😲

No wonder the Biden administration does NOT want Republicans taking control of the House and Senate in the midterm elections...who will, surely, add this to their growing list of intended investigations!


* UPDATE Nov. 1...

Some interesting statistics...(N.B. TWTR was delisted from the NYSE on November 28, since it was privatized, following its sale to Elon Musk)...


* UPDATE Nov. 4...

Who wouldn't like to a fly on the wall during these upcoming depositions?

Things should get "interesting" as Americans finally get the transparency, to which they are fully entitled.

* UPDATE Nov. 6...

With META reportedly poised to announce thousands of job layoffs sometime this week, it should be a wild week in markets with all eyes on Tuesday's midterm election results...isn't it interesting that they're waiting until after that to announce! 🤔


ZeroHedge excerpt

ZeroHedge excerpt

* UPDATE Dec. 3...

More information on Elon Musk, his private purchase of Twitter, and his actions to make public Twitter's shocking suppression of free speech under its former executives and employees can be found here.