WELCOME

Welcome and thank you for visiting!

The charts, graphs and comments in my Trading Blog represent my technical analysis and observations of a variety of world markets...
* Major World Market Indices * Futures Markets * U.S. Sectors and ETFs * Commodities * U.S. Bonds * Forex

N.B.
* The content in my articles is time-sensitive. Each one shows the date and time (New York ET) that I publish them. By the time you read them, market conditions may be quite different than that which is described in my posts, and upon which my analyses are based at that time.
* My posts are also re-published by several other websites and I have no control as to when their editors do so, or for the accuracy in their editing and reproduction of my content.
* In answer to this often-asked question, please be advised that I do not post articles from other writers on my site.
* From time to time, I will add updated market information and charts to some of my articles, so it's worth checking back here occasionally for the latest analyses.

DISCLAIMER: All the information contained within my posts are my opinions only and none of it may be construed as financial or trading advice...please read my full Disclaimer at this link.

Dots

* If the dots don't connect, gather more dots until they do...or, just follow the $$$...

Paris Cafe

Paris Cafe

ECONOMIC EVENTS

UPCOMING (MAJOR) U.S. ECONOMIC EVENTS...

***2026***
* Wed. July 29 @ 2:00 pm ET - FOMC Rate Announcement + Forecasts and @ 2:30 pm ET - Fed Chair Press Conference

*** CLICK HERE for link to Economic Calendars for all upcoming events.

Showing posts with label World Trade. Show all posts

Monday, April 21, 2025

GOLD: The Next Parabolic Bubble?

We'll see.

If we do see a blow-off in price at some point soon, perhaps 3000 will hold as support, since that was a technical upside target within the confluence zone of two major long-term Fibonacci levels, as per my post of December 6, 2022.

GOLD finally hit 3000 on March 11 of this year, for a gain of 68% -- and has nearly reached 3500 -- as shown on the following monthly chart.

P.S. Price briefly pierced through 3500 on April 22 before dropping back below during intraday trading.

GOLD Monthly chart

* UPDATE October 24...

So, 3000 held...and GOLD has been on an upward tear ever since.

As noted on the following monthly chart, it nearly hit 4400, where there has been some profit taking.

Barring any major negative global influences, there is no overhead technical resistance to stop its climb towards 5000.

GOLD Monthly chart

* UPDATE January 26, 2026...

No bubble burst yet...GOLD is still on a tear as it crossed above 5000 late last week, as shown on the following monthly chart.

There is no overhead resistance to stop this unprecedented massive accumulation, so, we'll see if it reaches its next big round number of 6000.

The most recent support level is 4400, denoted on the following daily chart. If 5000 is broken and held to the downside, we may see a retest of 4400 at some point, or somewhere around 4700.

Otherwise, momentum is with the bulls.

GOLD Monthly chart

GOLD Daily chart


Tuesday, August 16, 2022

WTI CRUDE OIL: Trading In A Chaos Zone

* See UPDATES below...

In my post of March 2 regarding WTI Crude Oil, I mentioned that my previous price Targets 1 and 2 (100.00 and 111.00-112.00), which I'd identified in my prior post of February 24, had been hit...and that Target 3 (147.27) still remained intact.

However, just days later, price hit a high of 130.50 on March 7...not quite tagging Target 3, but coming fairly close...before chopping around that level, then beginning a drop to current levels, as shown on the following monthly chart. 

Note that an extreme spike formed by the end of March on the ATR indicator...hinting that a price turnaround may be imminent. As I did in my March post, I've shown the ATR with an input value of one period to clearly illustrate that such a spike occurred that month.

Price is stuck, again, within, what I've dubbed a 'Chaos Zone,' in between 80.00 and 100.00

Previous attempted breakouts above this zone have been short-lived, since January 2008. In fact, those breakouts have all been followed by a large drop to retest long-term major support at 40.00.

Whether price drops to 40.00 any time soon, is anyone's guess. If it does, watch to see if the ATR forms another extreme spike to signal a potential price reversal.

However, if such a spike occurs at any price above that level on the monthly timeframe, a bounce may soon follow...possibly to tag or surpass Target 3 (147.27).

So, keep an eye on the ATR for clues in this regard.

* UPDATE Aug. 17...

Although world markets may be headed toward a recession, that may not negatively impact demand and the price of oil, as described in the following article.

* UPDATE Aug. 21...

However, the following court win for oil and gas exploration and production on U.S. federal lands may eventually bring down the price of Crude Oil and Gas whenever the producers in those states begin their operations...provided that Biden's EPA regulations aren't too cost-prohibitive and onerous at that time.


Saturday, July 16, 2022

German DAX Could Freefall To 10,000 Or Lower...Will That Affect The SPX?

* See UPDATES below...

In my post of March 7, I warned of a stong divergence between Germany's DAX with the European MSCI Financials ETF, EUFN.

Both have dropped since then, as shown on the following monthly charts.

While the DAX has had difficulty staying above 10,000 since 2015, the EUFN has repeatedly erased all gains above 14.00, which is rock-bottom major support, since its inception in 2010 (a risky investment as it turns out).


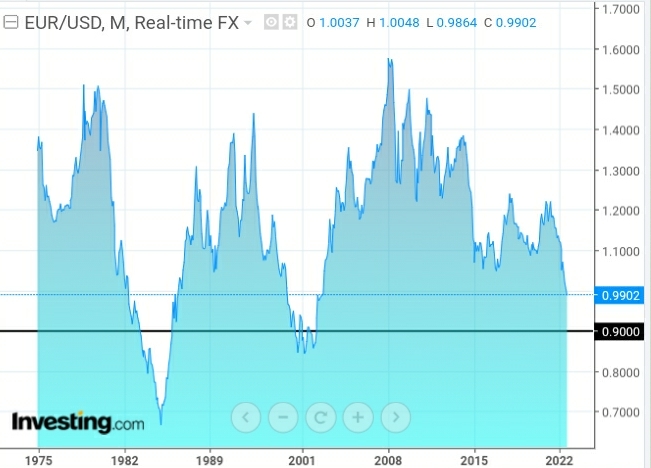
The EUR/USD has also dropped back to parity with the U.S. Dollar, as shown on the following monthly chart...a level not seen since 2002. Major support sits around 0.9000.

With major issues currently facing Germany and Italy, as described in the following articles, plus others in France, as well as Holland, Spain, Italy and Poland, it's only a matter of time before we see the DAX retest 10,000, or lower.

We'll see if such a move also drags down the SPX...watch for the level of upcoming Fed rate hikes and subsequent U.S. Dollar moves, especially the EUR/USD pair, for clues.


* UPDATE July 18...

More bad news for Europe's energy supply...

* UPDATE July 20...

It looks like Mario Draghi is closer to being ousted as Italian PM...causing the EUR/USD and EUFN to plunge after their recent brief rallies...

* UPDATE July 21...

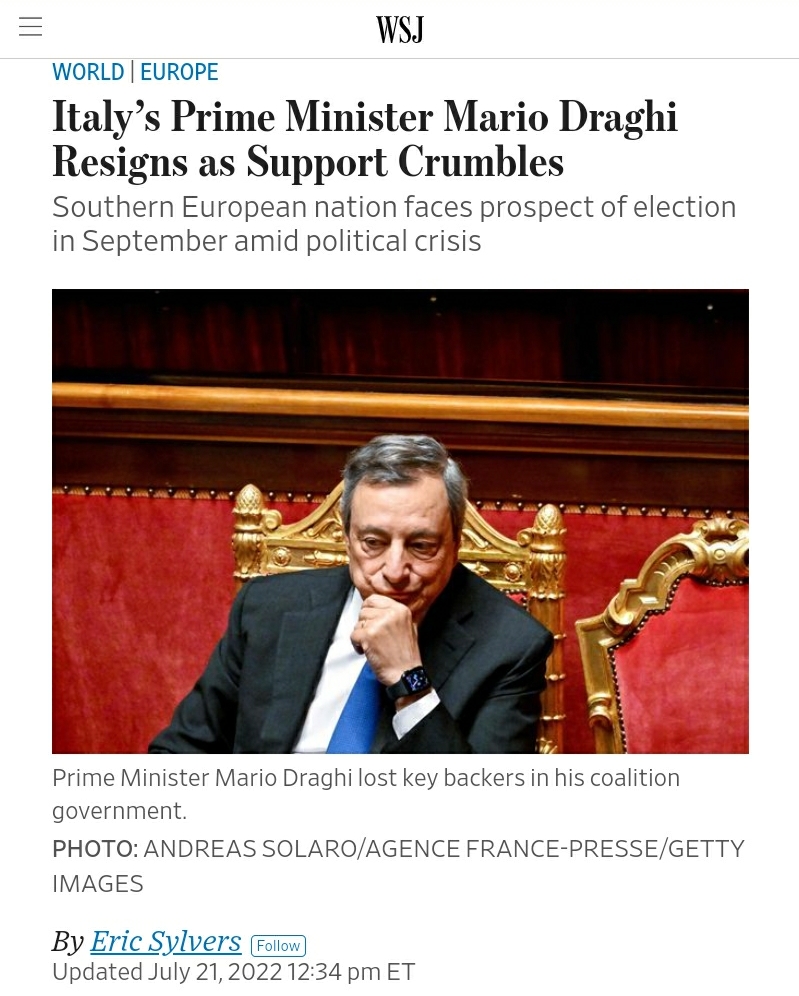
PM Draghi resigned today after losing support of his coalition government supporters...an election has been called for September...more chaos for Europe...

* UPDATE July 23...

A must-read article on Europe's prospective (grim) future...

This crisis is of Germany's own making with their punitive energy policies...

How stupid do they think people are? 😕

ZeroHedge excerpt

* UPDATE July 25...

Russia is turning the screws on Europe...stock up on deodorant supplies!

So, Mario Draghi made a mess of things in Italy, according to the following report. 

It seems that the Governor's gushing description of him was totally off the rails, not to mention blasphemous, as well! 🤔


ZeroHedge excerpt

* UPDATE Aug. 2...

Even Germany's dead may be negatively impacted by their energy policies...

* UPDATE Aug. 12...

It doesn't look like Germany's 'green energy' policies have helped Rhine River water levels, so far...a recession is "even more likely"...


ZeroHedge excerpt

More proof that Germany's 'green energy' program is failing and will cause more environmental damage than conventional energy sources...


ZeroHedge excerpt

* UPDATE Aug. 25...

It seems that German leaders will have to make a choice whether to serve the interests of their own citizens versus those of Ukraine in the near future...


ZeroHedge excerpt

* UPDATE Aug. 30...

It looks as though the EU is in the midst of growing dis-unity, and that the "easy" and "prolific" lifestyles of Europeans has fractured and is in jeopardy of a massive rug-pull, possibly to the point of no return.

And, the U.S. may not be far behind, as it digs itself further into debt at breakneck speed with no clear path of redemption, under Joe Biden's reckless and prolific spending actions.

No wonder EU unity is fracturing, as their newly-exposed "wheelings and dealings" are becoming questionable, at best!

* UPDATE Sept. 6...

The weakening Euro and EUFN ETF are signalling further weakness in the EU.

Market makers have been "pumping and dumping" those, along with the German DAX and, especially the STOXX 50 and STOXX 600 for years.

None of these have proved to be a viable long-term wise investment...so, it's not surprising to see this latest trend continue.


ZeroHedge excerpt

* UPDATE Sept. 18...

More dire energy supply news for Europe...

* UPDATE Sept. 21...

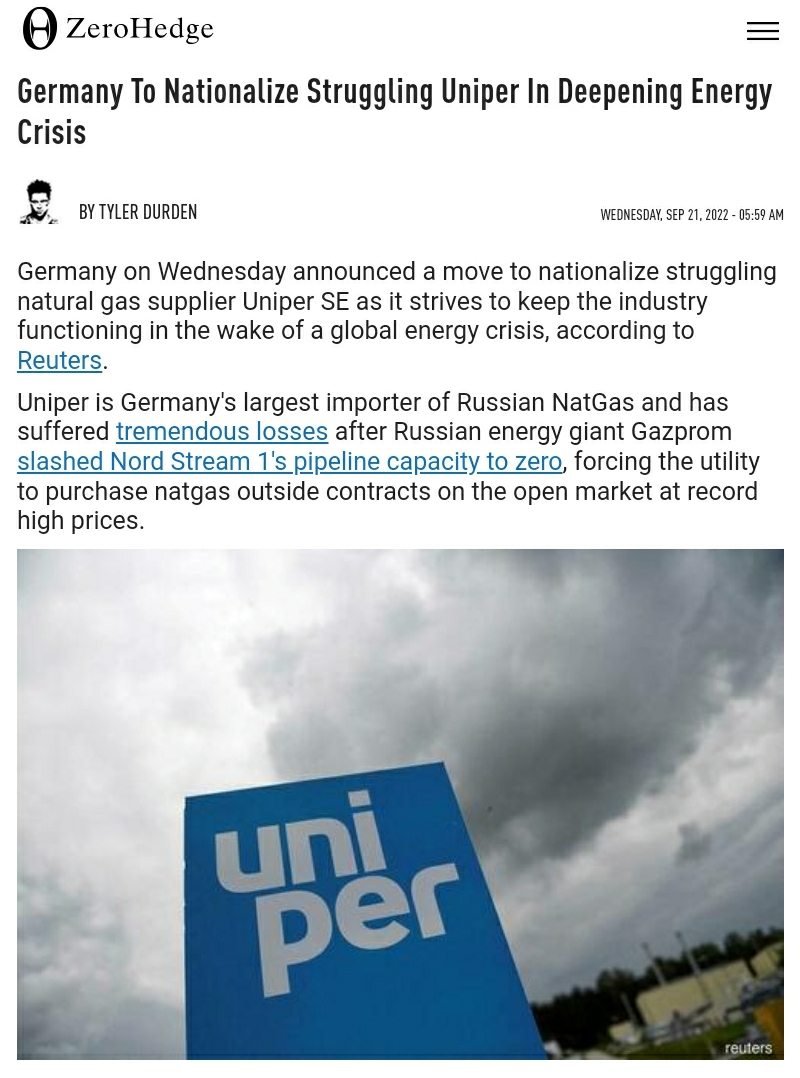
Good news and bad news for Germany and Europe...

* UPDATE Nov. 6...

An "interesting" take on things involving Germany, the EU, China and Russia...


Monday, March 14, 2022

China's Hang Seng Index Plunges Below Major Support...President Xi's Legacy Hangs In The Balance

* See UPDATES below...

Selling has acceletated to an all-time extreme level -- even exceeding that which occurred during the 2008/09 financial crisis -- in China's Hang Seng Futures Index (HK50), which has plunged below a major support level of 20,000 in Sunday night's wild trading, as shown on the following monthly chart (the price is still dropping as I write this post).

This follows my post of March 7, which warned of possible impending weakness in China's Shanghai Index (SSEC) due to diverging extreme weakness in its Financials ETF, GXC.

Failure to recapture and hold above 20,000 could see a swift plunge to 16,000, or lower.

The following article describes 11 major crises that China is facing, which may have contributed to its 4.3%+ drop, so far, from Friday's close.

N.B. The Hang Seng Index closed at 19,531.66 on Monday for a loss of 5.0% from Friday. As well, China's Hang Seng Tech Index lost 11%, the most ever...the Hang Seng China Enterprise Index lost 7.2%, the most since November 2008...and the Golden Dragon China Index lost 13%, for a two-day loss of nearly 30%...see this ZeroHedge report for details.

CONCLUSIONS

  • Perhaps President Xi will rethink his recent no-limits alliance with Russian President Putin -- due to Putin's new-found status as the "world's pariah" and the indiscriminate slaughter of innocent women and children and the war crimes he's committing in his barbaric war on Ukraine (moving ever closer to NATO neighbouring countries, in the process) -- and reconsider whether he, either, wishes China to remain a viable trading partner (and become more stable and trustworthy in the process) and attract foreign investment from the West, or risk losing that privilege altogether.
  • Either the world moves backward into fractured, unstable, waring, and bloody medieval times, dominated by unending depressions, famines and disease...or it moves into the 21st Century with grace and stability...or, it is obliterated by world-wide nuclear war.
  • President Xi has a big part to play in that decision.
  • Either way, he will be held responsible...and his legacy (and, by extension, China's) will reflect that choice, which he'll need to make, sooner rather than later.
 

N.B. The nuclear "Doomsday Clock" is ticking...and is now at "100 seconds to midnight," as noted in the following report...thereby, making President Xi's decisions that much more critical and urgent.


ZeroHedge excerpt

ZeroHedge excerpt

* UPDATE March 15...

Selling accelerated in overnight trading in China, as shown on the following monthly chart of the Hang Seng Index (HK50). It closed at 18,415.08 and lost another 5.72%. It was another bloodbath in Chinese major indices, as shown in the following table.

I've shown the chart in an "area" format to illustrate that any gains made since November 2006 have never held, to date...hinting that there has been something systemically wrong in China and its economy since then -- in the months leading up to the 2008/09 financial crisis and global market crash, and ever since -- and signalling that, what was wrong/broken, then, has never been fixed.

SO, if President Xi thinks that, by hitching up China's wagon to Putin's horse will make that situation any better, then I've got a bridge to sell him! 😕


More information on China's markets can be found in the following ZeroHedge article...it's not pretty.

* UPDATE July 18...

More trouble ahead for China...this time, it's their housing market...

* UPDATE July 25...

With investors pulling their money out of China on a scale second in size to the COVID crash, there is a "threat of a further disintegration of their financial system should their housing crash escalate further"...

* UPDATE July 31...

Tensions are heating up between the U.S. and China to dangerous levels...adding to an already-risky foreign investment environment in China...

* UPDATE August 6...

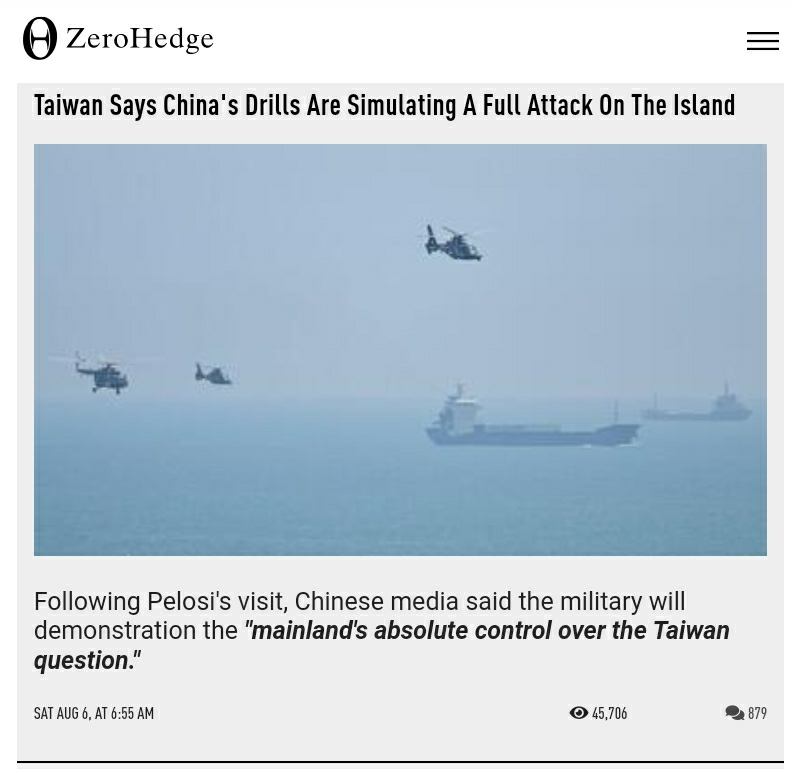
Oh, look...a military distraction is being conducted by China, while its Shanghai Index (SSEC) and Financial ETF (GXC) are poised to plunge below near-term fragile support, as shown on the monthly charts below.

The SSEC has had difficulty holding above 2500 since November 2006. Near-term support sits at 3000, while longer-term major support lies at 2000.

Near-term support for GXC sits at 80.00, while longer-term major support lies at 60.00.

A drop and hold below 3000 for the SSEC and 80.00 for GXC could send China's markets plummeting in short order.


* UPDATE Aug. 8...

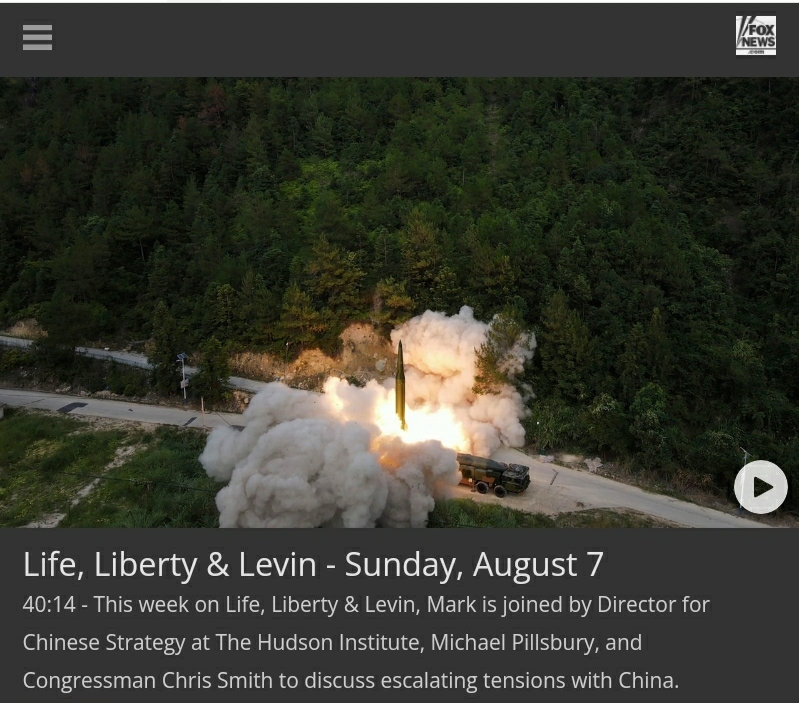
The growing global threats posed by China -- militarily, economically, financially, ecologically, environmentally, human rights abuses, global supply chain disruptions/blockades, etc. -- are described and discussed in detail in the following Life, Liberty & Levin video...

N.B. Further UPDATES can be found here.