WELCOME

Welcome and thank you for visiting!

The charts, graphs and comments in my Trading Blog represent my technical analysis and observations of a variety of world markets...
* Major World Market Indices * Futures Markets * U.S. Sectors and ETFs * Commodities * U.S. Bonds * Forex

N.B.
* The content in my articles is time-sensitive. Each one shows the date and time (New York ET) that I publish them. By the time you read them, market conditions may be quite different than that which is described in my posts, and upon which my analyses are based at that time.
* My posts are also re-published by several other websites and I have no control as to when their editors do so, or for the accuracy in their editing and reproduction of my content.
* In answer to this often-asked question, please be advised that I do not post articles from other writers on my site.
* From time to time, I will add updated market information and charts to some of my articles, so it's worth checking back here occasionally for the latest analyses.

DISCLAIMER: All the information contained within my posts are my opinions only and none of it may be construed as financial or trading advice...please read my full Disclaimer at this link.

Dots

* If the dots don't connect, gather more dots until they do...or, just follow the $$$...

Beach Drinks

Beach Drinks

ECONOMIC EVENTS

UPCOMING (MAJOR) U.S. ECONOMIC EVENTS...

***2026***
* Wed. June 17 @ 2:00 pm ET - FOMC Rate Announcement + Forecasts and @ 2:30 pm ET - Fed Chair Press Conference

*** CLICK HERE for link to Economic Calendars for all upcoming events.

Showing posts with label SPX:VIX Ratio. Show all posts

Thursday, April 10, 2025

SPX ALERT: Potential Retest of 200 MA Along With A Death Cross Event

While it's not a guarantee, it's not uncommon for the the S&P 500 Index (SPX) to bounce after a significant drop and retest its 200 MA, following the formation of a bearish moving average Death Cross.

We may be at that point, as the 50 MA is poised to drop below the 200 MA in the next couple of days, as shown on the following daily chart.

As you can see, the SPX has plunged a great deal since it reached its high of 6147.43 on February 19 in connection with President Trump's global tariff war, before reversing and spiking following its low of 5069.90 on April 4. It closed today at 5268.05 in a very large and volatile trading range.

A spike to around 5750ish to retest its 200 MA is possible (and close the gap down between April 2 and 3), given that the RSI, STOCH, and MACD indicators are hinting of such a scenario -- and that volatility is extreme, as shown on the following SPX:VIX daily Ratio chart -- before resuming its downtrend.

With the drama of Trump's day-to-day tariff/trade flip-flops, anything's possible, so we'll see what happens.

SPX Daily chart

SPX Daily Ratio Chart


Saturday, April 05, 2025

SPX TARIFF FALLOUT: Where Does It Go From Here?

I've recently written about President Trump's global tariff war, and its effects on U.S. and global markets, here and here.

Today's article will focus primarily on the S&P 500 Index (SPX) and what may lie ahead for its potential targets.

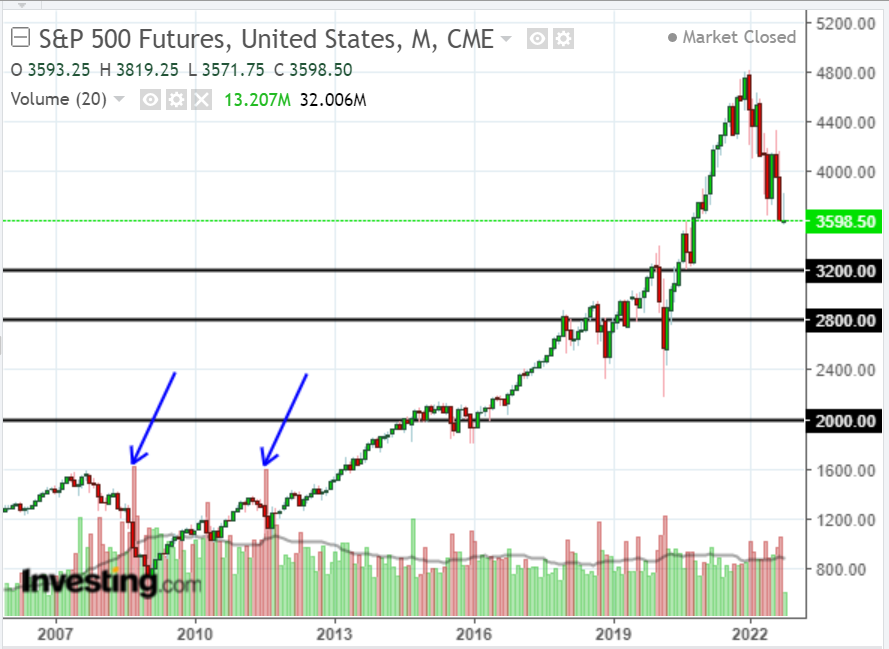
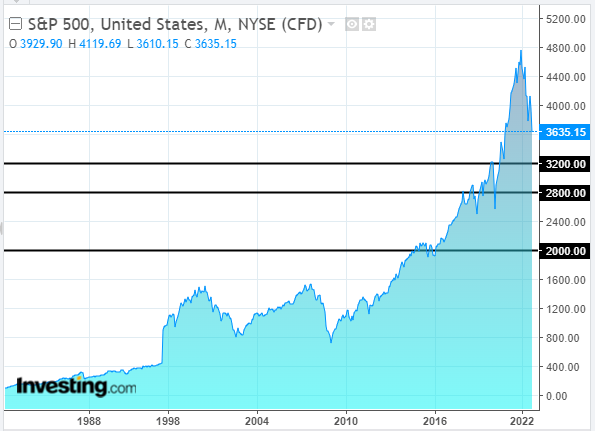
The following weekly SPX chart contains two Fibonacci retracement drawings...one taken from the week of the March 23, 2020 low of 2191.86 and the other from the week of the October 10, 2022 low of 3491.58, both to the all-time high of 6147.43 from the week of February 17, 2025.

I'm mainly interested in where their respective levels overlap or are fairly close, generally speaking, following its dramatic price drop in the past several weeks, which may determine price targets, as well as support/resistance levels, in the coming days/weeks.

Price is currently sitting below a confluence of two levels around 5130 and 5200. The next confluence levels lie from approximately 4500 to 4630 and 4800. Further below, the next ones sit around 4050 to 4170.

These areas of confluence represent upside and downside targets.

Weekly SPX chart

The following daily SPX:VIX Ratio chart may help to provide clues relative to support and resistance levels.

The ratio price is nearing a previous Bull/Bear Line-in-Sand level of 100, after plunging below its current level of 150.

A drop to 100 (or overshoot it a bit) may coincide with a price drop of the SPX to around 4800, or so.

Should the ratio continue its slide towards the 60 historical/critical Bull/Bear Line-in-Sand level, we may see the SPX plunge towards the lower confluence levels from 4050 to 4170.

The question, of course, is timing, as to how quickly or likely such scenarios may play out. That is up in the air and depends on momentum and external factors, such as economic conditions, monetary policy, financial policy and conditions, and political, business and consumer influence/pressure.

At the moment, the 50 and 200 MAs are currently under the influence of a bearish Death Cross on the SPX/VIX ratio...so, until they reverse, the bears are in control of price action.

Daily SPX:VIX Ratio chart

Year-to-date percentages gained/lost by the U.S. Major Indices are shown on the following graph.

Nasdaq Indices have been hit the hardest, followed by Small Caps, then S&P 500 and 100, and, finally, Dow Indices.

U.S. Major Indices
Percentages Gained/Lost YTD

U.S. Major Indices

Year-to-date percentages gained/lost by the U.S. Major Sectors are shown on the following graph.

Technology is the biggest loser, followed by Consumer Discretionary, Biotech, Home Builders, Industrials, Financials, Energy, Materials, Health Care, and Utilities. Consumer Staples gained 0.34%.

U.S. Major Sectors
Percentages Gained/Lost YTD

U.S. Major Sectors

Keep an eye on Technology and Consumer Discretionary for signs of a slowdown or pause, which may cause markets, in general, to follow suit.

With respect to the Consumer Discretionary sector, keep an eye on the Kraneshares Global Luxury Index ETF (KLXY).

It's fallen 15.63% below its IPO price, as shown on the following weekly charts

Further weakness in this ETF could spell further trouble for U.S. markets, in general.

KLXY Weekly chart

KLXY Weekly % chart

All in all, markets are currently very weak, with 
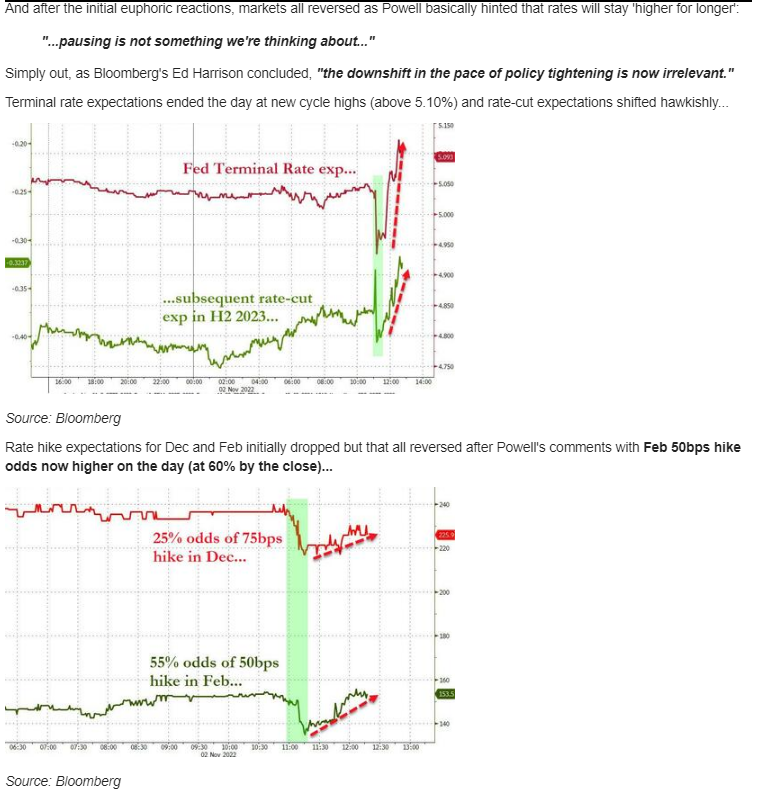
Fed Chair J. Powell signalling this past week that 
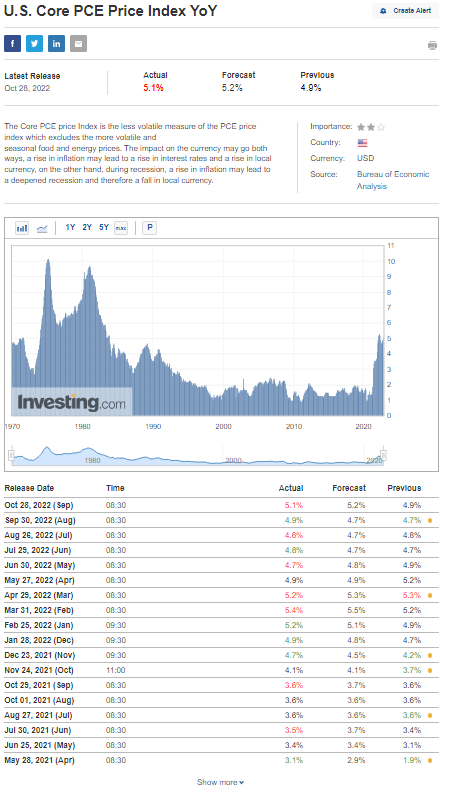
economic conditions are weakening and inflation is on the rise.

Should President Trump fail to reverse course on ALL of his excessively punitive and damaging tariffs on countries around the world, we may see stagflation rear its ugly head in the U.S. -- and the SPX drop to around 4050 -- sooner rather than later (with daily plunges in global markets, like this past Friday's, as shown below)...before we see capitulation and reversal in U.S. markets.

N.B. In any event, what country's leader would trust him ever again to negotiate any kind of new trade agreement in good faith (and honour them), inasmuch as he just blew up all of them with these tariffs...and could do so again, on a whim👀

AND, he's given NO indication that he would remove these tariffs, even if new trade agreements were negotiated! In fact, he has already stated that they are permanent

How else would he be able to pay for his plan to extend income tax cuts and get Congressional approval to do so?

Global Markets April 4, 2025

FINALLY, I'd just mention that the U.S. MOVE Index (which measures the level of volatility in Treasury futures) has not yet spiked to historical highs, as shown on the following monthly chart.

Should that continue rising, look for stocks to continue to drop.

MOVE Index Monthly chart

So, buckle up!

* UPDATE April 7...

U.S. markets paused by the end of the day, following volatile and extreme intraday whipsaw moves to the upside and downside, while Asian and European markets (et al) plummeted in overnight trading...some much more than others.

We'll see how long any deadcat bounce occurs in world markets, in general, before continuing another leg down.

As long as President Trump's tariffs remain in place on global markets, creating rising economic and business investment uncertainty/chaos, this scenario is a distinct probability.

Such extreme volatility is NOT a sign of healthy markets, especially in the U.S.!

TIP: Watch and wait for what Trump ACTUALLY DOES (confirmed in writing in, either, an Executive Order, or a signed trade agreement)...NOT what he SAYS he will do/is doing...to verifyBUT, then there's that TRUST issue that been forever damaged, regardless...🤔


Wednesday, November 02, 2022

U.S. Fed: "No Pause" To Refresh

* See UPDATE below...

US Fed Chairman Jerome Powell emphasized several times during his press conference, following today's FOMC rate hike of 0.75% to 3.75%-4%, that the Fed is NOT pausing their rate hikes, as they're focused on raising rates until inflation comes back down to their target 2% rate...

"It's premature to discuss pausing and it's not something we're thinking. That's really not a conversation to be had now. We have a ways to go."

He referred to the US Core Consumer Price Index (CPI) YoY and US Core PCE Price Index YoY multiple times during the Q&A period. They are highly elevated at 40-year levels, as shown on the following graphs, and there is no hint they are falling any time soon...particularly as the costs of oil and gas show no signs of abating, and they affect the price of everything.

The SPX plunged 134.75 points from its high today of 3894.55 and closed at its low of the day at 3759.69.

So, in spite of the constant barrage of "We think the Fed's going to pause or pivot, soon..." from TV analysts and pundits, it seems that the Fed ignored all of that rhetoric, once again, to focus on their job of reducing inflation.

How many times will these talking heads cry wolf? And, how many times will the market take their bait

As long as that scenario keeps repeating itself, ad nauseam, we'll continue to see "Dead Cat Bounces" occur in the SPX bear market...as well as volatile whipsaw intraday swings.


ZeroHedge excerpt


SPX Daily

WTI Crude Oil Monthly

* UPDATE Nov. 6...

What happens when bad news is bad news?...🤔


Seeking Alpha excerpt

Seeking Alpha excerpt


Wednesday, October 12, 2022

S&P 500 FUTURES INDEX: A Clue To Capitulation

When we see an extreme volume spike form on the following monthly chart of the S&P 500 Futures Index (ES), it may be close to a bottom/capitulation, particularly if it falls near one of the major support levels, as shown.

Further bottoming clues are described, in detail, in my articles of October 2, September 30, and September 24, pertaining to the corresponding SPX and the SPX:VIX Ratio.

Until then, I expect volatility to continue, producing large intraday swings in both directions.


Sunday, October 02, 2022

SPX: Q3 Wrap-Up & Outlook For Q4 2022

* See UPDATE below...

Further to my posts of September 30 and September 24, the following will summarize SPX market action for the month of September, Q3 and year-to-date.

Please refer to the following three charts...namely, the yearly, quarterly and monthly timeframes for the SPX.

YEARLY TIMEFRAME:

A bearish engulfing candle has formed, so far, this year on the yearly chart, and it has a range of 1,234.49 points...the second largest on record, after the 2020 range. It closed at a new low in 2022 and well below its yearly pivot point of 3996.12.

The SPX:VIX ratio, shown at the bottom of the chart in histogram form, is sitting just above an important major support level of 100.00, and has fallen below both 5 and 20-year MAs...depicting extreme bearishness on this timeframe.

SPX Yearly Chart

QUARTERLY TIMEFRAME:

Note the long upper spike on the Q3 candle, where it faked a bullish reversal, before falling to a new quarterly low close for 2022...and well below its quarterly pivot point of 3831.68.

The SPX:VIX ratio, shown at the bottom of the chart in histogram form, is sitting just above an important major support level of 100.00, and has fallen well below both 5 and 20-quarter MAs (which are about to form another bearish crossover)...depicting extreme bearishness on this timeframe.

SPX Quarterly Chart

MONTHLY TIMEFRAME:

Note the long upper spike on the September candle, where it faked a bullish reversal, before plunging and closing at a new low for 2022...and well below its monthly pivot point of 3763.01.

The SPX:VIX ratio, shown at the bottom of the chart in histogram form, is sitting just above an important major support level of 100.00, and has fallen well below both 5 and 20-monthly MAs (which formed another bearish crossover in April)...depicting extreme bearishness on this timeframe.

SPX Monthly Chart

PIVOT POINTS FOR OCTOBER:

The following Pivot Point Calculator depicts the Pivot Point, 3 Resistance Levels, and 3 Support Levels for the month of October (taken from the data of the September candle)...which are possible upside and downside targets.

Note that the S2 target is in line with the first major support level of 3200, mentioned in my post of September 30, while S3 sits just above the next major support level of 2800, also mentioned therein.

CONCLUSIONS:

  1. As I mentioned in my post of September 30, until we see the SPX:VIX ratio fall to somewhere around 80.00, or more likely 60.00, I don't think we're close to an equity capitulation, yet.
  2. Furthermore, and, as I concluded in my post of September 24, all in all, I see no pivot away from U.S. Dollar strength and global equity and sector (and Bitcoin) weakness...YET.
  3. So, for the moment, U.S. cash is king, as the U.S. Fed has signalled its intent to continue raising interest rates and keep them elevated for some time after inflation has declined to the Fed's 2% maximum inflation target...which could last well into 2025.
  4. As an aside, my 2021 Market Wrap-Up and 2022 Forecast (written on January 1) has been fairly accurate, to date. By the way, the S2 target for the 2022 timeframe (calculated from the 2021 candle) is close to 3200 (and the Pivot Point from the 2020 candle sits at 3236.04), while the S3 target is close to 2800...both of which are likely targets, either for October, or sometime this year...especially 3200, where there is a confluence of a variety of Pivot Point targets, as well as (first) major price support. Here are several excerpts from that post, as well as my last update therein...


Finally, until President Biden drastically changes course from his 'Big Government Tax & Spend' agenda, and unleashes the oil and gas industry by dropping his overly-restrictive and punitive regulations, trade with caution, as I expect high volatility and large intraday swings to continue!

* UPDATE Oct. 10...

If JP Morgan CEO Jamie Dimon's projection is correct, a further 20% drop on the SPX (from 3600) would send it down to around 2880...and in line with the S3 target mentioned above...or 2800 on a downside overshoot.

While it may not hit that level this month, 2800 is a major price support level shown in my article of September 30...and a possible eventual target.

SPX Monthly (intraday price October 10)


Friday, September 30, 2022

SPX: A Big-Picture Market Perspective...Still Room For More Rate Hikes and Market Weakness

Check out the following two long-range monthly charts of the S&P 500 Index (SPX).

With the current Federal Reserve Interest Rate still only at 3-3.25%, and the SPX still 395% above its 2009 low, it seems to me that there is still a lot of room for more rate hikes to tame inflation, which may bring price down to around 3200 -- its first major support level -- or even lower.

That would blow off the excess parabolic froth that was created in this market from mid-2020 and bring equities more in line with actual economic and global supply-chain conditions.


Until we see the SPX:VIX ratio fall to somewhere around 80.00 or, more likely, 60.00, I don't think we're close to an equity capitulation yet.

So, look for more rate hikes ahead and more SPX weakness...which is in line with my conclusions in my post of September 24.

P.S. The SPX closed the daymonthQ3 and YTD much lower and just a breath above its low of the day, month, Q3, and YTD...at 3585.62.


Sunday, August 21, 2022

SPX: Will That Be CASH or CRASH?

* See UPDATES below...

I added the following update today in my post of July 26 pertaining to the MSCI World Index:

To that, I'd note that it's still a bear market for the SPX (currently below its 50 MA) on a weekly timeframe (until it makes a higher swing low and higher swing high), as shown on the following chart.

A drop and hold below the 50 MA on the following weekly chart of the SPX:VIX ratio could signal that we'll see another leg down on the SPX.

For further clues on such a possibility, keep an eye on the following daily chart of the SPX:VIX ratio.

If price drops and holds below its 200 MA, if the RSI drops and holds below 50.00, and if the MACD and PMO form and hold bearish crossovers, we'll see the SPX drop, possibly to a new weekly swing low, especially if a bearish Death Cross reforms and holds on the SPX:VIX ratio weekly timeframe.

* UPDATE Aug. 22...

Noteworthy today...as at 1:11pm ET:

  • the SPX has gapped down on the open and plunged to well below last week's low, as shown on the weekly chart,
  • the SPX:VIX ratio has dropped below both 50 and 200 MAs, as shown on the weekly chart,
  • and the SPX:VIX ratio has dropped below its 200 MA, but is still above the 50 MA, the RSI has dropped below 50.00, and bearish crossovers have formed on the MACD and PMO, as shown on the daily chart.

We'll see if the SPX continues to weaken, along with the SPX:VIX ratio, as traders await Fed Chairman Powell's remarks on Friday at the annual Jackson Hole Economic Policy Symposium for any hints of upcoming interest rate hikes, either more hawkish or dovish than anticipated.

However, I seem to recall that Chair Powell has not, typically, telegraphed the Fed's intentions on future rates in his previous Jackson Hole speeches...so, I wouldn't expect him to veer off course in this one.

P.S. The SPX closed at 4137.99, after making a low of 4129.86 today.


* UPDATE Aug. 26...

Fed Chairman Powell spooked U.S. markets with his unmistakable hawkish outlook for interest rates and the pain ahead for Americans and companies...

The SPX and other Major Indices plunged on the news...and closed at/near their lows of the day.

This may be the catalyst that begins the next leg down on the weekly timeframe, as outlined above.

 SPX Daily

* UPDATE Sept. 3...

With approximately half of all U.S. companies anticipating that they will have to lay off workers over the next 12 months, and many Americans becoming homeless, President Biden should get busy and concentrate on fixing his broken economy (of his own making), instead of demonizing half of the country, as he did in his reprehensible speech on Thursday.


Joe Biden Speech Sept. 1, 2022


The stocks markets have erased all of their gains made since Biden took office on January 2021.

So, he's even ruined that segment of America with his out-of-control and debt-ridden spending packages.


The National Debt owed per taxpayer is nearly $245,000 and rising by the nano-second!

It seems that Joe's fond of red!

N.B. Until the President drastically changes course (a good start would be to unleash the oil and gas industry and drop his overly-restrictive regulations), trade with caution!