WELCOME

Welcome and thank you for visiting!

The charts, graphs and comments in my Trading Blog represent my technical analysis and observations of a variety of world markets...
* Major World Market Indices * Futures Markets * U.S. Sectors and ETFs * Commodities * U.S. Bonds * Forex

N.B.
* The content in my articles is time-sensitive. Each one shows the date and time (New York ET) that I publish them. By the time you read them, market conditions may be quite different than that which is described in my posts, and upon which my analyses are based at that time.
* My posts are also re-published by several other websites and I have no control as to when their editors do so, or for the accuracy in their editing and reproduction of my content.
* In answer to this often-asked question, please be advised that I do not post articles from other writers on my site.
* From time to time, I will add updated market information and charts to some of my articles, so it's worth checking back here occasionally for the latest analyses.

DISCLAIMER: All the information contained within my posts are my opinions only and none of it may be construed as financial or trading advice...please read my full Disclaimer at this link.

Dots

* If the dots don't connect, gather more dots until they do...or, just follow the $$$...

Beach Drinks

Beach Drinks

ECONOMIC EVENTS

UPCOMING (MAJOR) U.S. ECONOMIC EVENTS...

***2026***
* Wed. June 17 @ 2:00 pm ET - FOMC Rate Announcement + Forecasts and @ 2:30 pm ET - Fed Chair Press Conference

*** CLICK HERE for link to Economic Calendars for all upcoming events.

Showing posts with label Annual Market Wrap-Up. Show all posts

Friday, December 23, 2022

2022 Market Wrap-Up: 'Like Watching Paint Dry'

The May 2022 'long-legged doji' foretold how the second half of the year would unfold on the S&P 500 Index (SPX)...with choppy, volatile indecision.

As shown on the following monthly chart, the price has, essentially, traded sideways in a large trading zone, between 3500 and 4300.

It's bounced back and forth between Buyers and Sellers, like a yo-yo.

As it's turned out, any gains, either on the long or the short side, have been short-lived...much like the first half of 2022 was.

Day-to-day or week-to-week trading for 2022 has been erratic and non-directional...and about as interesting as 'watching paint dry.'

Unless you took profits during the December 2021 candle -- which followed November's bearish 'shooting star' (which wasn't confirmed until January's 'bearish engulfing' candle) -- and, either, shorted the markets and held, or, simply stayed out, you were caught up in this slow slip downwards, dominated by choppy large-scale sideways consolidations.

As I mentioned in my post of December 21, we may see a fourth 'candy cane' form in January 2023, with a price target of 3200...if Sellers remain in control.

We'll see what happens.

I hope to post my Annual Forecast for the New Year in the next few days, so stay tuned. As a reminder, my 2021 Market Wrap-Up & 2022 Forecast can be read here.


Sunday, May 01, 2022

Remedy For Fed-Fuelled Wall St. Gluttony...Purging

* See UPDATES below...

What is Wall Street to do after gorging on cheap money, supplied in abundance by the U.S. Federal Reserve ever since they slammed the brakes on heavy losses caused by the 2008/09 financial crisis?

Purge, of course...as evidenced by the following 10 major technology stocks...all of which are currently in the FNGU ETN basket of stocks.

Judging by the massive haemorrhaging that has occurred this year, it seems that the respective values of these stocks were wildly over-inflated by pure speculation, based solely on cheap money supply...not on the actual value of these stocks and their products/services.

You'd think that the Fed would have learned their lesson by now and not fuelled another stock market bubble, as they've done in the past.

There's no telling where these and other stocks will end up over the next months, but with the Fed pulling the plug on their latest (failed) money-printing experiment, it appears that consumers are finally dictating what their priorities are...and spending their ever-shrinking dollars on basic necessities, and not the 'latest and greatest shiny baubles.'

As long as inflation continues to rage and the global supply chain keeps on sputtering and breaking, with talk of impending recession swirling in the mix, I doubt we'll see equity markets race to new highs over the next several years. Instead, volatility will continue to remain at the forefront of short-lived plunges and spikes in both directions...and indecision will plague market players.

Therefore, I still stand by my market assessment described in my post of March 8.

The following one-year charts of the 10 tech stocks that are within the FNGU ETN basket exemplify the volatility that has plagued equity markets since the beginning of the year, and, in some cases, for a year, or more.

The following graph shows the percentages that these stocks have lost year-to-date.

To add a little more perspective on a couple of these stocks, the following charts compare longer-term monthly price action of NFLX with FNGU and AMZN with FNGU.

I'd say that they, and especially FNGU, portray the gluttony and purging described above.


Some additional details regarding AMZN's poor performance are provided in the following ZeroHedge article.

And, there's this ZeroHedge market analysis...

As an aside, another example of this gluttony and purge scenario is the ARK Innovation ETF, ARKK (containing 141 stocks), as shown on the following monthly chart comparing it to FNGU. You can see that it has traded in lock-step with FNGU over the years.

ZeroHedge has provided a bit more 'colour commentary' on this ETF, as follows.

P.S. To repeat what I said in March..."Best of luck...it's crazy 'out there'...and rumours are flying everywhere!" 😏

* UPDATE May 4...

The Federal Reserve raised interest rates by 0.50% today. 

This tweet sums up where we're at, thanks to the Fed's overly-accommodative policies during the past years...too little, too late...they are a joke.

* UPDATE May 7...

I'm at a loss for words...which doesn't happen very often...

* UPDATE May 19...

The Fed's loose monetary policies have forced people to invest their savings into riskier assets that they wouldn't normally have taken in order to generate a real return...eventually creating bubbles which pop...

* UPDATE July 19...

Leverage, expansion and liquidity are favoured policies of the U.S. Fed...but at what cost? 😕

* UPDATE July 20...

Place the blame for inflation on the Fed and the U.S. government...where it belongs...


ZeroHedge excerpt

* UPDATE Sept. 21...

More pain ahead as the Fed raised their rates another 0.75% today and signalled higher rates for longer...markets dumped and the US Dollar spiked on the news...


ZeroHedge excerpt

* UPDATE Sept. 23...

More confirmation of pain ahead...for consumers, businesses, and markets...as the purging continues...


ZeroHedge excerpt

The SPX has plunged over the past two weeks and is close to retesting its 2022 low of 3636.82, or lower...and Goldman Sachs has a new crash target of 3150.

* N.B. For more Fed UPDATES click this link.


Tuesday, March 08, 2022

How Accurate Has My 2022 Market Forecast Been, So Far?

Check out my 2022 Market Forecast of January 1, and see how accurate it's been, to date.

As a quick reminder, the following was my conclusion at the time...my position hasn't changed, and I've written extensively about the markets (including "shocking surprises") since then.

P.S. Just when you thought you'd seen all the "shocking surprises" the world could handle this year, you can add one more to the growing list...


ZeroHedge excerpt

* UPDATE March 10...

This follow-up report provides clarification on this issue...

Best of luck...it's crazy "out there"...and rumours are flying everywhere! 😏


Saturday, January 22, 2022

TECHNOLOGY SECTOR: Approaching Terminal Velocity

* See UPDATE below...

I last wrote about FNGU (an exchange-traded note that tracks 3x the daily price movement on an index of US-listed technology and consumer discretionary companies) in my post of December 20, 2021.

As you can see from the following monthly chart, it failed to recapture and hold above the 33.00 level, mentioned therein, and closed at 25.74 on Friday.

It's approaching a price support zone from 20.00 to 25.00. We may see it attempt to stabilize somewhere within this zone in the coming days.

If not, a drop and hold below 20.00 could be catastrophic for the Technology Sector.

The ten stocks that make up FNGU are shown on the following 1-year daily charts.

Most of them are at or near price support, with the exception of TWTR, which is well below for the year.

The following daily ratio chart of the NDX:VXN ratio shows that a bearish moving average Death Cross formed several days ago, and price has fallen below major support of 500.

I noted in my post of January 21 that a Death Cross had also formed on the SPX:VIX ratio and that the 'sell the rip' traders had overtaken the 'buy the dippers.' The same is true for this ratio.

If the NDX:VXN drops and holds below 400, its next major support level sits at 300, followed by 250 and 200, respectively.

In conclusion, if FNGU falls and holds below 25.00, and if the NDX:VIX ratio falls and holds below 400, and if the ten FNGU stocks fall and hold below their near-term price support levels, I wouldn't be surprised to see FNGU retest the lower edge of its support zone at 20.00.

A drop and hold below 20.00 on FNGU and below 300 on the NDX:VXN ratio could be catastrophic for the Technology Sector.

Keep an eye on the price action and support levels on the SPX and SPX:VIX ratio described in the aforementioned post for possible corroborating clues in this regard.

* UPDATE February 2...

Apparently TWTR has been replaced by MSFT in the FNGU ETN basket of stocks. The following revised one-year daily chartgrid of FNGU and its 10 stocks incorporates this update.


Friday, January 21, 2022

SPX: In For A 50% Correction?

The following article refers...it mentions a possible 50% correction on the SPX.

I last wrote about the SPX and the SPX:VIX Ratio in my post of January 17

If Jeremy Grantham's call for the SPX to correct by nearly 50% from its top at 4800 to his major support level around 2500 comes to fruition, the last four and a half years of wealth accumulation will be wiped out, as shown on the following monthly chart of the SPX.

That level is well below S3 (2870) mentioned in my 2021 Market Wrap-Up and 2022 Forecast post.

The SPX:VIX Ratio closed below the major support level of 200 in Thursday's trading, as shown on the following daily ratio chart.

This follows the formation of the moving average Death Cross discussed in my January 17 post.

If price holds below 200, this does not bode well for the SPX, inasmuch as it seems that the 'sell the rip' traders have overtaken the 'buy the dippers' at this point.

This will continue, in my opinion, provided that the Fed does NOT interfere, but allows the equity market to self-correct and find its fair value.

I'd keep an eye on whether fair value and market stabilization occur around any of the following ratio levels, namely 150, 100, 80, or 60

A drop and hold below 60 would be catastrophic for the SPX and could send it plunging to 2500, or lower.

President Biden's two-hour question and answer session with the press on January 19 did absolutely nothing to stabilize the markets.

I won't bore you with the details. Many others have reported on his disastrous answers and performance...true to form, it wasn't pretty.

If you want to see for yourself, you can view the video link below.


Monday, January 17, 2022

Death Cross Forms On SPX:VIX Ratio

I last wrote about the SPX in my 2021 Market Wrap-Up and 2022 Forecast on January 1.

The SPX closed (around 20 points below the 50-day moving average) at 4662.85 last Friday, as shown on the following daily chart. The 200-day moving average is well below at 4420.84, which is slightly above the yearly Pivot Point for 2022 of 4412.61 (identified in my above-mentioned post). Both moving averages are still in uptrend.

The SPX uptrend is wavering and price is caught in a large and tightly bunched-up consolidation range.


A 50/200-day moving average Death Cross just formed on the SPX:VIX Ratio, as shown on the daily ratio chart below...at variance with the moving averages on the SPX.

It's a warning signal that weakness has crept into the SPX and we may see it pull back or correct soon.

A 10% drop would send it down to 4200, while a 20% drop would take it to 3730.

Alternatively, it may be a bear trap.

These two scenarios should become more clearly defined after the next Fed meeting on January 26.

In the meantime, trading will likely remain volatile and whippy...especially below 4700.


Saturday, January 01, 2022

2021 Market Wrap-Up and 2022 Forecast

My 2020 Market Wrap-Up and 2021 Market Forecast can be found at this link.

After witnessing an unusual number of wild parabolic spikes and plunges on a variety of trading instruments during 2021, I'd posit that 2022 will see a return to a state of quasi-rationality... out of necessity in order to preserve one's remaining stash of cash

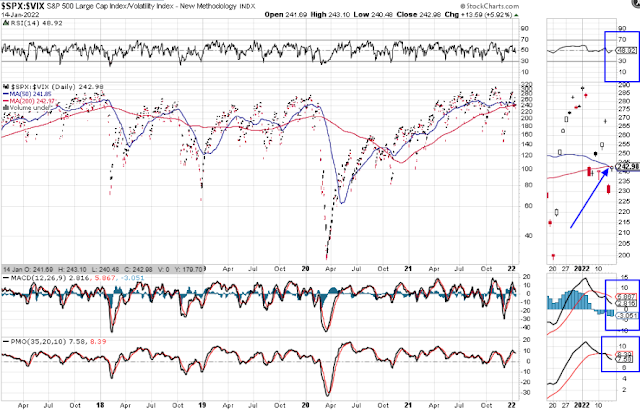
BUT, this will create higher volatility, lower volumes, lower trend sustainability, longer periods of consolidation, lower expectations, and lower certainty, overall.

2022 will be hung over with higher (persistent) inflation, COVID-19 variants and accompanying economic disruptions, increased interest rates, a changing political landscape, increasing national and international security concerns, and a skyrocketing national debt, to name a few headwinds.

In fact, it may very well feel like market makers/movers and shakers have you "on hold" at times.

There will be surprises, some quite shocking (to markets) if/when they become common knowledge.

"Don't think money does everything,
or you are going to end up
doing everything for money."
-- Voltaire

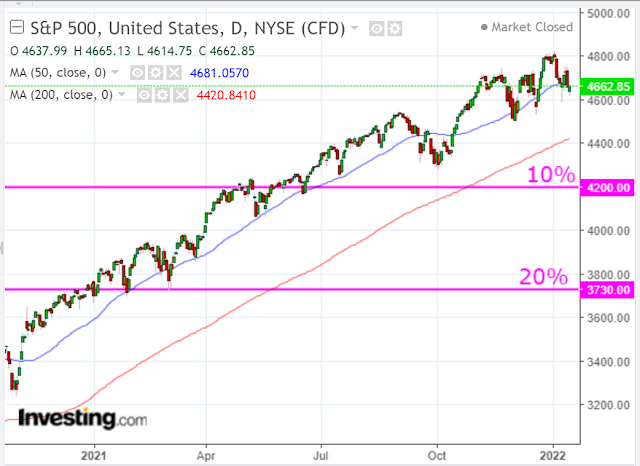
At its height, the SPX gained around 29.5% for 2021. Assuming we do see quasi-rationality take hold, we could expect to see a gain of around half of that in 2022 -- a 16%+/- increase by year end -- IF the tailwinds outweigh the headwinds

Its trading range for 2021 was 1,146.22 points, with a high of 4808.93 and a low of 3662.71, as shown on the following yearly chart.

The following Pivot Point calculations are provided to illustrate a variety of support and resistance levels/price targets on the yearly timeframe for the SPX. They are based on the high/low/close of the 2021 candle for 2022's levels/price targets.

The Pivot Point of 4412.61 for 2022 (identified below) is one and the same as the Pivot Point depicted on the 2021 yearly candle in the chart above (small horizontal white line). It will act as a major support/resistance level for 2022, with R1/R2/R3 acting as minor resistance and S1/S2/S3 acting as minor support levels.

If the SPX sees a gain of around 16% for 2022 from 2021's close of 4766.18, it may reach a high of 5528.80. That price is just 30 points shy of the R2 target at 5558.83.

However, if it falls and holds below the Pivot Point at 4412.61, we could see a catastrophic plunge ensue in the equity markets...and markets worldwide.

In conclusion, look for more stable and valuable sectors and stocks, commodities, bonds, and currencies which, potentially, may act as a safer hedge against the headwinds (and, as yet, unrevealed shocking surprises) described above.

BUT, keep your wise wits about you!

"If there is no wisdom,
rationality can be very dangerous."
-- Nirmala Srivastava

~~~~~~~

Happy New Year and best of luck in 2022!

~~~~~~~

* UPDATE January 5...

It appears that the Fed is confirming many of my 2022 "hangover" assessments, as outlined in their minutes released today from their last meeting. 

As I write this update at 2:30 pm ET, the SPX is currently selling off, but remains above the upper edge (4700) of a sideways consolidation zone that began last November...now considered minor support

A drop and hold below 4700 will see a return to a trendless, whippy and volatile market until it breaks and holds below 4500.


* UPDATE January 7...

The US 10-year treasury yield (US10YT) has spiked upward since the beginning of this year, as shown on the monthly chart below...confirming Fed sentiment described above.

It's now well above major support of 1.50 and is on its way to 2.00...or higher.

And, there's this report pertaining to yields...

* UPDATE January 8...

The following article provides a good explanation of how we got to the point of inflation headaches for the Fed...and where things are headed...(HINT: bad news for consumers)...

* UPDATE January 12...

Inflation has gone vertical over the past two years, as has the SPX...looks like a correlation to me.

CPI (Consumer Price Index) came in at 7.0% today.

By the way, inflation has spiked way above what it was just prior to the 2008/09 financial crisis.

If that's not a warning to traders, I don't know what is! 😕

And, it's bad news for President Biden and his far-left spending agenda/spree. 

So, what will he do for the next three years of his first term that will benefit all Americans?

Unless he shifts radically away from his socialist agenda and unconstitutional mandates and moves toward a centrist stance, he will be hamstrung by factors such as spiking inflation and plummeting poll numbers (currently in the low 30s).

So, brace yourselves for stagflation until the 2024 election.
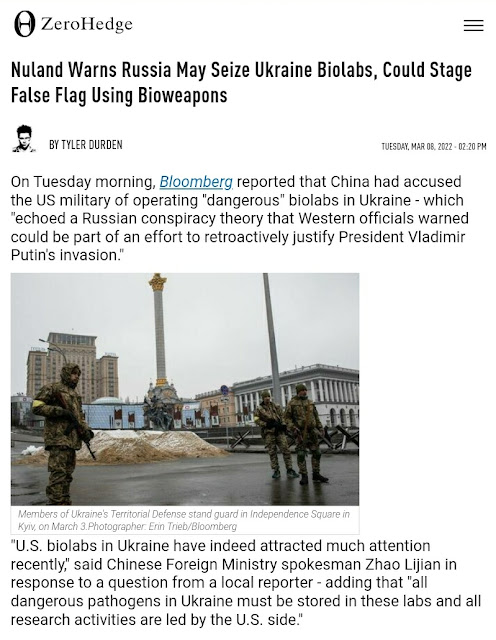

Zerohedge excerpt


Sunday, January 03, 2021

2020 Market Wrap-Up and 2021 Market Forecast: A Dimmer Sun?

Perhaps the most valuable commodity this year will be Vitamin D, thanks to Bill Gates' proposal to "dim the sun" and his support for large-scale, endless lockdowns. 😏

My Annual 2020 Market Wrap-Up and 2021 Market Forecast is extremely short this year. We live in an upside-down world, propped up by central banks and government stimulus...likely to continue this year, thanks to the effects of the COVID-19 global pandemic.


The S&P 500 Index (SPX) gained a total of 1,568.34 points from the low to the high of 2020, and the Balance of Power (BOP) is still firmly in the hands of Buyers, as shown on the following monthly chart

However, the BOP for December is a fraction below November's, so the buying was slightly more subdued last month and may portend a slower pace in the coming months.

The next major resistance is represented by the 1.382% External Fibonacci level at 3850.57. Major support lies below at the "Big Round Number" of 3600.

Barring another retest of 3600, as we saw during three weeks of November, I'd expect the buying to continue up to 3850.57, or higher, in the coming weeks/months.

However, stocks may be getting overvalued, as shown on the following ZeroHedge chart. Perhaps 2021 may usher in more stock splits...or a 10-20% correction.

We'll see what happens...but, keep an eye on the rate of buying/selling, as represented by the BOP indicator.


P.S.

By the way, the SPX "iceberg" is still afloat.