WELCOME

Welcome and thank you for visiting!

The charts, graphs and comments in my Trading Blog represent my technical analysis and observations of a variety of world markets...
* Major World Market Indices * Futures Markets * U.S. Sectors and ETFs * Commodities * U.S. Bonds * Forex

N.B.
* The content in my articles is time-sensitive. Each one shows the date and time (New York ET) that I publish them. By the time you read them, market conditions may be quite different than that which is described in my posts, and upon which my analyses are based at that time.
* My posts are also re-published by several other websites and I have no control as to when their editors do so, or for the accuracy in their editing and reproduction of my content.
* In answer to this often-asked question, please be advised that I do not post articles from other writers on my site.
* From time to time, I will add updated market information and charts to some of my articles, so it's worth checking back here occasionally for the latest analyses.

DISCLAIMER: All the information contained within my posts are my opinions only and none of it may be construed as financial or trading advice...please read my full Disclaimer at this link.

Dots

* If the dots don't connect, gather more dots until they do...or, just follow the $$$...

Paris Cafe

Paris Cafe

ECONOMIC EVENTS

UPCOMING (MAJOR) U.S. ECONOMIC EVENTS...

***2026***
* Wed. July 29 @ 2:00 pm ET - FOMC Rate Announcement + Forecasts and @ 2:30 pm ET - Fed Chair Press Conference

*** CLICK HERE for link to Economic Calendars for all upcoming events.

Showing posts with label E-mini Futures Indices. Show all posts

Friday, February 25, 2022

SPX: Beware Of Market And Political Rumours

The compressed daily S&P 500 Index (SPX) chart below depicts what trades look like based on a variety of market and political news reports (rumours), depending on their scale of perceived importance.

November 26, 2021 began a series of large, wild whipsaw daily and weekly swings in both directions...depicted by the Average True Range indicator shown in histogram format and based on an input value of one period.

That day, the WHO identified Omicron as a new and highly infectious and transmissible COVID-19 variant of concern. 

There have been many rumours flying about on that subject, ever since...sending markets gyrating into chaotic swings.

On January 24, 2022, the White House Press Secretary proclaimed that US citizens residing in Ukraine should leave immediately due to invasion threats from Russia.

And, there have been many rumours flying about on that subject, ever since...sending markets gyrating into chaotic swings.

It seems to me that until these issues, and other international and national security concerns are settled, one way or another, the SPX will continue to thrash about wildly and will remain stuck in this large trading range (between 4200 and 4800).

My post of February 21 and update of February 23 contain further details describing various scenarios that are possible for the S&P 500 Futures Index (ES)...keep an on those for clues regarding direction/trend and beware of rumours as long as the SPX stays in this range.

N.B. The following proposal regarding the Russia/Ukraine conflict sounds like sane advice given in 2015, don't you think? 

Too bad it wasn't taken seriously by "the powers that be."

Also, it seems as though what the West was promising Ukraine years ago were the same rosy promises used for 20 years in Afghanistan, and look how that ended, courtesy of President Biden.

By the way, there's much more on that school of thought at this Zero Hedge article.

~~~~~~~

BEWARE: If it sounds too good to be true, it probably is. 😕


Thursday, February 24, 2022

WTI CRUDE OIL: Little Price Resistance Above 100.00...Retest Of 147.27 Is Possible

I last wrote about WTI Crude Oil in my post of September 12, 2021.

I identified price targets of 80.00 and 100.00, provided it broke and held above 70.00.

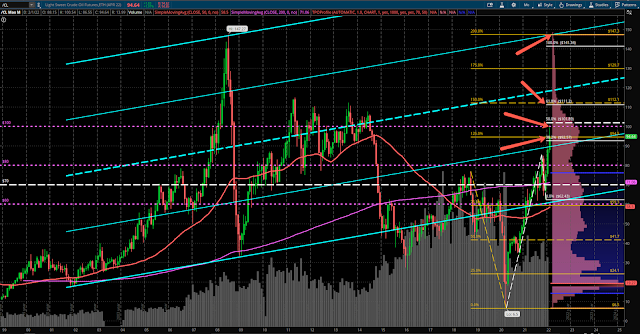
Following Russia's declaration of war and invasion last night of UkraineOil hit 100.54 today, before falling back to close at 94.75...which is around a convergence point (lower red arrow) of a 40% Fibonacci Extension level with a 125% External Quadrant level, and is just above the bottom 1/4 of a long-term rising channel, as shown on the following monthly chart.

There is little price resistance above 100.00, as shown on the pink TPO Profile along the right-hand side of the chart.

Price targets are identified by the other three red arrows, which are also convergence points on the Fibonacci Extension with the External Quadrant. The highest red arrow also happens to converge with the upper 1/4 of the rising channel.

If price can remain above 90.00, it has a good chance of continuing its rally to these three targets, namely, 100.00, then 111.00-112.00, and then, ultimately, retesting its prior all-time high of 147.27.

Otherwise, a drop and hold below 90.00 could see a retest of 80.00, then 70.00, or lower.

At the moment, the "path of least resistance" is up.


Monday, February 21, 2022

S&P 500 Futures Index Approaching Bearish Head & Shoulders Neckline

* See UPDATE below...

My post of January 31 contained Pivot Point support and resistance levels/targets for February for the S&P 500 Index (SPX).

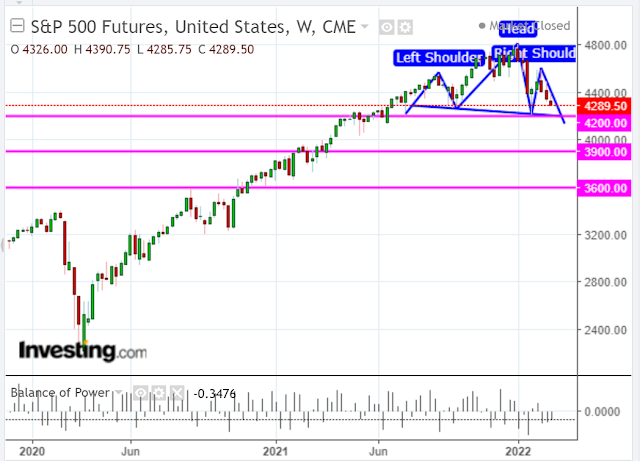
The following weekly chart of the S&P 500 Futures Index (ES) shows that price is in the midst of forming a bearish Head and Shoulders pattern.

The sloping neckline on this formation sits around 4200, which is just below February's SPX S1 support level.

Should price break below that level, the next levels of support are around 3900 and 3600, respectively...just below SPX S2 and S3.

The Balance of Power is still held by the sellers...and will continue if price breaks and holds below 4200.

If not, price will continue its volatile, directionless whipsaw swings in both directions within this typical topping pattern.

* UPDATE February 23 (11:00 pm ET)...

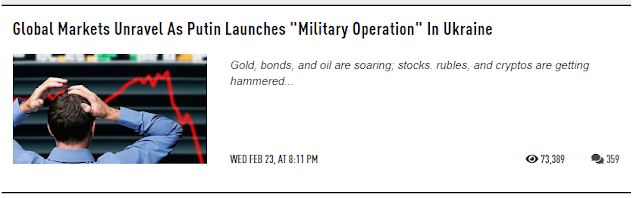
WAR: Russian President Vladimir Putin has declared war on and attacked Ukraine.

Fox News Pentagon correspondent Jennifer Griffin just reported that,"It's the beginning of a very serious full-scale military invasion of Ukraine, according to a senior U.S. administration official."

Markets around the world are plunging.

Follow ZeroHedge on Twitter @zerohedge for live commentary.

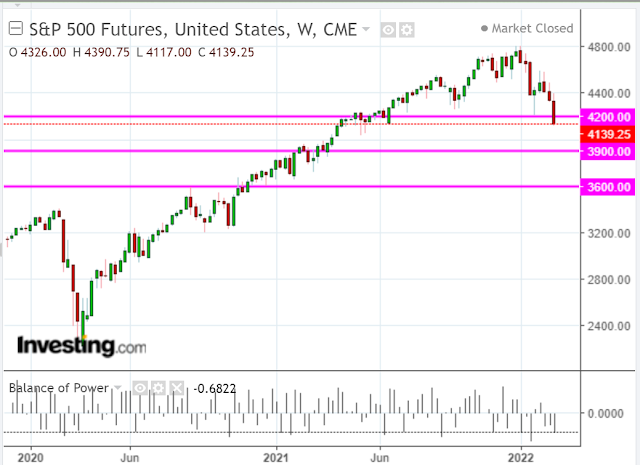
As at 11:00 pm ET, the S&P 500 Futures Index (ES) has sliced through the Head & Shoulders neckline at 4200 and is trading well below, as shown on the following weekly chart.

The next major support level lies at 3900.

SO, NOW WHAT?

President Biden needs to immediately reverse his ban on the Keystone XL pipeline project from Canada and reverse restrictions on oil and gas drilling in the U.S., in order to unleash increased production and bring down spiking oil, gas and gasoline prices that triggered, and are contributing to, the inflation spike.

Inflation is out of control and stagflation is biting its heels...threatening national security! 

This is not a problem that can be solely rectified by the Federal Reserve

Biden's administration owns this and it is incumbent on President Biden to restore economic and national security stability to the United States...without further delay.

Wake up, America!

~~~~~~~

NOTHING
FALLS INTO
THE MOUTH
OF A
SLEEPING LION.
- Wise words with love from your ancestors.

~~~~~~~


Monday, June 29, 2020

DANGER: Alligator Crossing on the S&P 500 E-mini Futures Index

Further to my post of June 21 with respect to the SPX, I'd just mention that the three moving averages (each offset into the future) forming the Williams Alligator on its counterpart S&P 500 E-mini Futures Index (ES) have all crossed to the downside, as shown on the following daily chart.

As well, the Awesome Oscillator has just turned negative in Sunday's overnight trading.

Both of these are signalling potential further weakness ahead.


Price on the following SPX:VIX ratio chart has slipped below 100, once again.

It needs to retake and hold above 100, the RSI needs to rise and hold above 50, and MACD and PMO bullish crossovers need to reform to signal potential sustainable SPX strength.

So, keep an eye on whether these ratio parameters can manifest, together with a rally and hold of the ES above 3075, plus a reversal and uncrossing of the Alligator moving averages to the upside, along with a reversal and hold of the AO above the zero level.

Otherwise, we may see more SPX selling to retest its June low of 2965.66, or lower.


Monday, May 25, 2020

SPX Target: 3100 By May 29

* See UPDATES below...

My post of May 21 identified a pivot point resistance value/target (R1) of 3095.86 for the S&P 500 Index (SPX) for the month of May.

Its S&P 500 E-mini Futures Index counterpart (ES) has almost touched the 3000 level in Monday evening's trading session, as shown on the following daily chart.

There are four trading days left in May for the SPX to reach its R1 value, which coincides with the next technical resistance level of around 3100 for the ES (the median of an uptrending channel converging with overhead price resistance).

The Balance of Power lies with the buyers and Momentum is still on the rise, so I'd give it a 55% chance of making that target...we'll see what happens.

The last time I gave the SPX a 55% chance of moving higher, it was about 100 points lower on May 17, so I'll stick with that percentage for now.


* UPDATE May 30...

The SPX didn't quite reach its potential R1 target of 3095.86 for the month of May. Rather, it hit a high of 3068.88 by month's end and was just 24.57 points shy of that target, as shown on the following monthly chart.

However, in my post of May 17, I gave the SPX a 55% chance of moving higher, when its price was 2863.70. Since then, it gained 205.18 points in nine trading days into the end of May.

So, all in all, I'd have to say that the the bulls were a little more than 55% successful in moving this market higher, even though it didn't quite make its R1 target.


* UPDATE June 3...

The SPX finally reached my 3100 target today, albeit, three day's late, as shown on the following daily chart. In fact, it blew right through it to reach a high of 3131.40.

Its next support and resistance levels/targets are outlined in my post of May 30.

It looks like my crystal ball is in need of an upgrade. 😉


Sunday, May 17, 2020

U.S. Markets Emerging From Chaos

* See UPDATE below...

The following daily, weekly and monthly charts of the four U.S. E-mini Futures Indices show that they are at the emerging edge of chaos [which is defined by three future-offset moving averages (green 5MA, -3), (red 8MA, -5), and (blue 13MA, -8)].

In all of these three timeframes, the NQ is the strongest and is the most favoured to continue its rally, while the ES is next, followed by the YM and RTY.

In the short term, watch for all three of the moving averages to curl upwards on the daily timeframe (with the green above the red above the blue), and for price to break and hold above all of them, to confirm that a sustainable rally is supported.

In the medium term, watch for all three of the moving averages to curl upwards on the weekly timeframe (with the green above the red above the blue), and for price to break and hold above all of them, to confirm that a sustainable rally is supported.

In the longer term, watch for all three of the moving averages to curl upwards on the monthly timeframe (with the green above the red above the blue), and for price to break and hold above all of them, to confirm that a sustainable rally is supported.

As well, the NQ is the only index that is above both the 50 and 200 moving averages on all three timeframes. These two moving averages pose as resistance or support levels on the YM, ES and RTY on all three timeframes. Look for the YM, ES and RTY to eventually break and hold above both of these moving averages in order to support any further rally and breakout to new record highs by the NQ.

Furthermore, we're about to see a bullish Golden Cross form on the 50 and 200 MAs on the NQ daily timeframe. If that occurs and holds, we'll likely see the rally continue.

If the NQ fails to continue its bullish leadership, we may see all four indices drop to, potentially, new lows, especially if the NQ drops and holds below its 50-week MA (currently at 8245).

YM/ES/NQ/RTY Daily charts

YM/ES/NQ/RTY Weekly charts

YM/ES/NQ/RTY Monthly charts

As of Friday's close, the Balance of Power still rests with the bulls on the SPX, as shown on the monthly chart below.

If the BOP drops and holds below the zero level, that control will switch to the bears on this timeframe, and we may see the SPX drop to around 2675 (the apex of the expanding triangle), or lower.

SPX Monthly chart

The SPX:VIX ratio is holding above 80 and may be headed towards its next resistance level at 100, as shown on the following daily ratio chart.

All three technical indicators (RSI, MACD and PMO) are hinting of higher prices for the SPX.

Under that scenario, the RSI should hold above 50, and the MACD and PMO should begin to swing upwards.

SPX:VIX Daily ratio chart

SUMMARY

If I were a betting woman, I'd say that the SPX has around a 55% chance of moving higher over the coming days/weeks, albeit in a choppy and, sometimes, volatile manner.

Keep an eye on the information and charts that I've shown above as potential directional gauges in the days/weeks ahead.

* UPDATE May 18...

Here's how the U.S. Major Indices fared throughout the day and into the close...


SPX Monthly chart

SPX:VIX Daily ratio chart

Wednesday, April 15, 2020

SPX:VIX Ratio: The Next Hurdle

The next hurdle for the SPX:VIX ratio is 80.00, as shown on the following daily ratio chart.

As I mentioned in my post of March 12, 2750 was an important level for the SPX. It was where its counterpart, the S&P E-mini Futures Index broke below the bottom of a long-term uptrending Andrew's Pitchfork channel (taken from the 2009 low to 2020's high) and was trading at 2441.00 that day. Such a technical break usually signals that a new bearish trend would form. On March 23, the SPX hit a new low of 2191.86 and reversed the next day.

The SPX closed back above 2750 on April 9 and remains above as of Tuesday's close at 2846.06.

For short-term clues on the where the SPX may be headed, the important support and resistance levels are identified on the SPX:VIX ratio. As I mentioned above, if this ratio can reclaim the 80.00 level, its next target would be 100.00...and we'd see the SPX continue to rally under this scenario.

Conversely, should the SPX:VIX ratio break and hold below 60.00 once again, then we'll see the SPX plunge below 2750 and possibly make a new low...below that made on March 23.


Thursday, March 12, 2020

Market Stability: Are We There Yet?

WORLD MARKETS


Further to my last post, world markets continued to plunge in Thursday's trading, as shown below.

Source: indexq.org

S&P 500 E-MINI FUTURES INDEX


The S&P 500 E-mini Futures Index (ES) is currently trading after-hours (8:00 pm ET) near its Thursday close, as shown on the monthly chart below.

Price is caught around/near major support, comprised of:

  • the -1.75 deviation level of the long-term uptrending Andrew's Pitchfork channel taken from the 2009 low to 2020's high (2400ish)
  • the 60% Fibonacci retracement level taken from the 2016 low to 2020's high (2400)
  • the 40% Fibonacci retracement level taken from the 2009 low to 2020's high (2350)

Price has clearly broken below the bottom of the the channel around 2750, which usually signals that a new bearish trend will form.

The Rate-of-Change (ROC) and Average True Range (ATR) technical indicators have both spiked to new all-time extreme levels (I've shown them both with an input value of one period in histogram format to illustrate this clearly).

Such extreme spikes generally indicate that capitulation is near and that price may begin to stabilize soon.

We may see lower prices, however, in the meantime.


SPX:VIX RATIO


The SPX:VIX ratio has fallen off a cliff and closed at 32.87 (a level last seen in 2009), as shown on the following daily chart.

The moving averages have formed a new bearish Death Cross, signalling more weakness ahead for the SPX.

If that crossover holds, look for extreme levels of volatile price swings in both directions, with possible lower prices on the SPX around 2350ish, until we see a sustainable bounce, with conviction, and a possible retest of the lower edge of the channel around 2750.

A drop and hold below 2350 could produce a catastrophic spike down to somewhere between 2140 and 2030, or lower.


U.S., GERMAN & CHINESE FINANCIAL SECTORS


Finally, keep an eye on the XLF:SPX ratio daily chart. It's now down near a 5-year major support level and the moving averages have formed a new bearish Death Cross, signalling more weakness for the Financial Sector (XLF).

Price is attempting to stabilize the last several days, but if it drops lower, it could drag the SPX down, as well.


And, keep an eye on the next two ratios.

The first is the EUFN:DAX ratio (the European Financial Sector ETF compared with the German Index, DAX), and the second is the GXC:SSEC ratio (China's Financial Sector ETF compared with the Shanghai Index, SSEC).

They're also both at their respective major support levels.

A drop and hold below current price will likely drag their respective indices down, as well.


BOTTOM LINE


If the above-referenced three financial sectors remain much weaker than their index counterparts, then we'll likely see more weakness in world markets, in general, along with heightened volatility, notwithstanding a variety of monetary and fiscal stimulus measures currently being deployed or planned by central bankers and world governments.

As I mentioned in my last post, 2008/09 was a bank financial crisis.

This is an economic crisis, health crisis, and global supply-chain crisis, and one that is multiplying every several days in depth and breadth...not easily or quickly resolved by monetary and fiscal stimulus, particularly if they're not adequately and correctly targeted.

If conditions persist and market weakness persists, this may also become a bank financial crisis.

Watch for drops in consumer confidence and spending, along with rising unemployment numbers, for possible clues in this regard.

* UPDATE March 13...


A massive Friday the 13th turnaround occurred in the S&P 500 E-mini Futures Index (ES) following measures that were announced earlier by the Treasury Department, a subsequent White House press conference announcing a variety of measures that will be implemented in response to the coronavirus, including the declaration of a National Emergency by the President., as well as the passage of a virus relief package by the House late Friday evening, which has yet to be approved by the Senate.


Based on the above analysis of the Andrews Pitchfork study, 2750 is, technically, where the 10-year bull market trend reversed into a bear market trend.

We'll see if that level can be recaptured, with conviction, and held next week...especially if the US Fed cuts interest rates any further at their meeting on March 18.

The bear-market trend will be reversed once, and if, the ES eventually makes a new all-time high and establishes a subsequent series of new swing highs and lows on the daily timeframe.


Wednesday, March 11, 2020

World Markets Thrash and Bash

N.B. The following chart and data screenshots were taken between 2:00 & 3:00 pm ET today (March 11)...

S&P 500 Index (SPX) Daily chart

SPX:VIX Daily ratio chart


Source: ZeroHedge.com

(he says an overall mortality rate of around 1%, but check out Italy's rate below)


Source: justthenews.com

2008/09 was a bank financial crisis.

This is an economic crisishealth crisis, and global supply-chain crisis, and one that is multiplying every several days in depth and breadth...not easily or quickly resolved by monetary and fiscal stimulus, particularly if they're not adequately and correctly targeted.


N.B. How U.S. markets closed...


SPX Weekly chart
N.B. There are 3 types of gaps in a trend: 
breakaway, continuation and exhaustion.
If the second gap holds, we could see much lower prices 
before the final exhaustion gap is made.


When will emerging markets (EEM) catch up with, or overtake, the U.S. market flush?


N.B.

Check out my recent articles on my Blog for details on charts and market gauges I'm monitoring during these chaotic times.

P.S.

Following President Trump's oval office (9:00 pm ET) address to the nation on the coronavirus pandemic, the S&P E-mini Futures Index (ES) nearly tagged 2600 right before trading was limit-down halted Wednesday night, as shown on the following daily chart.

Tomorrow should be interesting.

S&P 500 E-mini Futures Index (ES) Daily chart

S&P 500 E-mini Futures Index (ES) Monthly chart
Overnight trading almost touched the confluence (2600) of
the bottom of a long-term uptrending Andrew's Pitchfork channel 

(taken from the 2009 low to 2020's high)
and 
the 50% Fibonacci retracement level 
(taken from the 2016 low to 2020's high).


Click this link to view the video