WELCOME

Welcome and thank you for visiting!

The charts, graphs and comments in my Trading Blog represent my technical analysis and observations of a variety of world markets...
* Major World Market Indices * Futures Markets * U.S. Sectors and ETFs * Commodities * U.S. Bonds * Forex

N.B.
* The content in my articles is time-sensitive. Each one shows the date and time (New York ET) that I publish them. By the time you read them, market conditions may be quite different than that which is described in my posts, and upon which my analyses are based at that time.
* My posts are also re-published by several other websites and I have no control as to when their editors do so, or for the accuracy in their editing and reproduction of my content.
* In answer to this often-asked question, please be advised that I do not post articles from other writers on my site.
* From time to time, I will add updated market information and charts to some of my articles, so it's worth checking back here occasionally for the latest analyses.

DISCLAIMER: All the information contained within my posts are my opinions only and none of it may be construed as financial or trading advice...please read my full Disclaimer at this link.

Dots

* If the dots don't connect, gather more dots until they do...or, just follow the $$$...

Paris Cafe

Paris Cafe

ECONOMIC EVENTS

UPCOMING (MAJOR) U.S. ECONOMIC EVENTS...

***2026***
* Wed. July 29 @ 2:00 pm ET - FOMC Rate Announcement + Forecasts and @ 2:30 pm ET - Fed Chair Press Conference

*** CLICK HERE for link to Economic Calendars for all upcoming events.

Showing posts with label Pivot Points. Show all posts

Monday, February 21, 2022

S&P 500 Futures Index Approaching Bearish Head & Shoulders Neckline

* See UPDATE below...

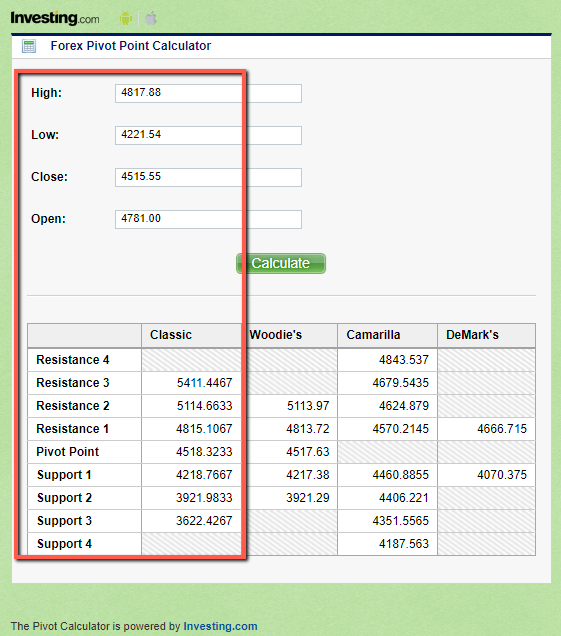
My post of January 31 contained Pivot Point support and resistance levels/targets for February for the S&P 500 Index (SPX).

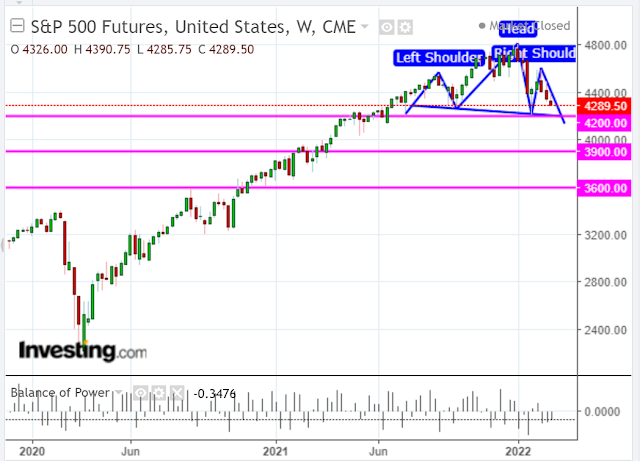
The following weekly chart of the S&P 500 Futures Index (ES) shows that price is in the midst of forming a bearish Head and Shoulders pattern.

The sloping neckline on this formation sits around 4200, which is just below February's SPX S1 support level.

Should price break below that level, the next levels of support are around 3900 and 3600, respectively...just below SPX S2 and S3.

The Balance of Power is still held by the sellers...and will continue if price breaks and holds below 4200.

If not, price will continue its volatile, directionless whipsaw swings in both directions within this typical topping pattern.

* UPDATE February 23 (11:00 pm ET)...

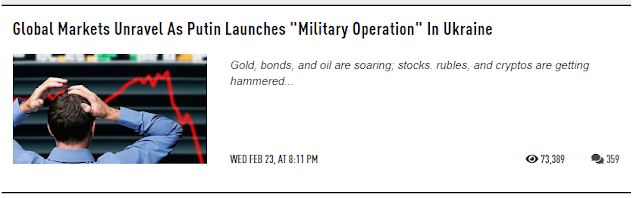
WAR: Russian President Vladimir Putin has declared war on and attacked Ukraine.

Fox News Pentagon correspondent Jennifer Griffin just reported that,"It's the beginning of a very serious full-scale military invasion of Ukraine, according to a senior U.S. administration official."

Markets around the world are plunging.

Follow ZeroHedge on Twitter @zerohedge for live commentary.

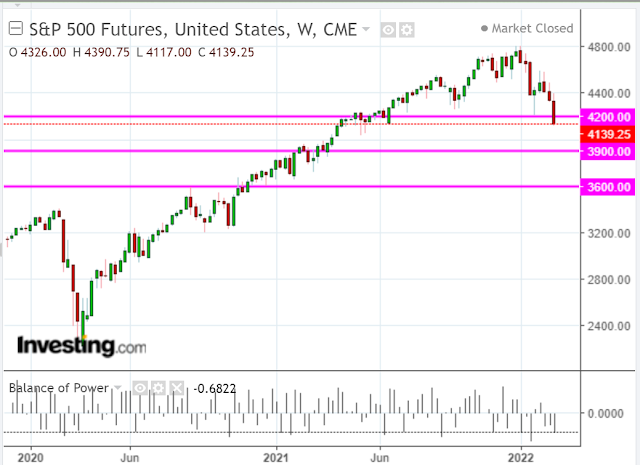
As at 11:00 pm ET, the S&P 500 Futures Index (ES) has sliced through the Head & Shoulders neckline at 4200 and is trading well below, as shown on the following weekly chart.

The next major support level lies at 3900.

SO, NOW WHAT?

President Biden needs to immediately reverse his ban on the Keystone XL pipeline project from Canada and reverse restrictions on oil and gas drilling in the U.S., in order to unleash increased production and bring down spiking oil, gas and gasoline prices that triggered, and are contributing to, the inflation spike.

Inflation is out of control and stagflation is biting its heels...threatening national security! 

This is not a problem that can be solely rectified by the Federal Reserve

Biden's administration owns this and it is incumbent on President Biden to restore economic and national security stability to the United States...without further delay.

Wake up, America!

~~~~~~~

NOTHING
FALLS INTO
THE MOUTH
OF A
SLEEPING LION.
- Wise words with love from your ancestors.

~~~~~~~


Monday, January 31, 2022

SPX Pivot Points For February 2022

The following pivot point calculations and chart are provided to illustrate a variety of support and resistance levels/price targets on the monthly timeframe for the S&P 500 Index (SPX).

The calculations below are based on the high/low/close of January's candle for February's pivot point levels/price targets.

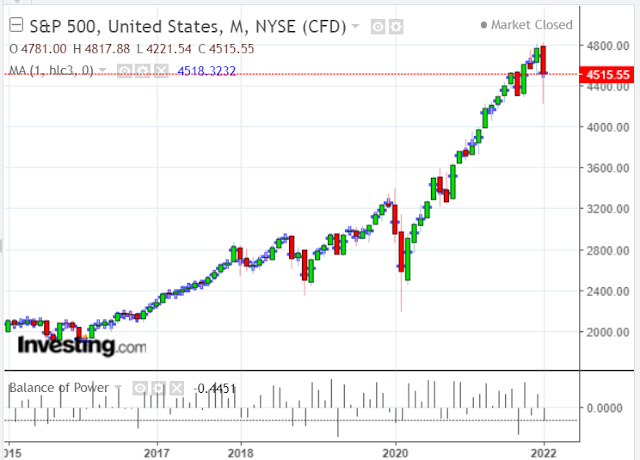
The following monthly chart shows that January's candle closed just below the Pivot Point for February (noted above at 4518.3233) [depicted as the horizontal blue moving average...1-month MA (h/l/c/)].

Similarly, the February R1 and S1 pivot point levels/price targets are very near January's high and low.

So, we may see either, or both, of those levels re-tested before a new monthly trend is created and, subsequently, confirmed in the coming months.

At the moment, the Balance of Power has flipped from buyers to sellers on this timeframe. Keep an eye on this indicator for clues on future monthly price action, market sentiment and trend confirmation.


Friday, January 21, 2022

SPX: In For A 50% Correction?

The following article refers...it mentions a possible 50% correction on the SPX.

I last wrote about the SPX and the SPX:VIX Ratio in my post of January 17

If Jeremy Grantham's call for the SPX to correct by nearly 50% from its top at 4800 to his major support level around 2500 comes to fruition, the last four and a half years of wealth accumulation will be wiped out, as shown on the following monthly chart of the SPX.

That level is well below S3 (2870) mentioned in my 2021 Market Wrap-Up and 2022 Forecast post.

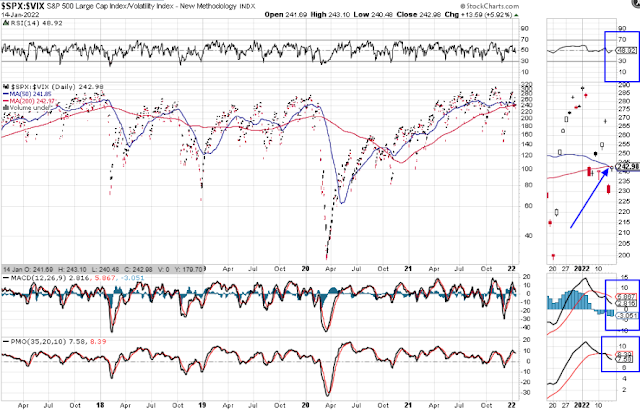
The SPX:VIX Ratio closed below the major support level of 200 in Thursday's trading, as shown on the following daily ratio chart.

This follows the formation of the moving average Death Cross discussed in my January 17 post.

If price holds below 200, this does not bode well for the SPX, inasmuch as it seems that the 'sell the rip' traders have overtaken the 'buy the dippers' at this point.

This will continue, in my opinion, provided that the Fed does NOT interfere, but allows the equity market to self-correct and find its fair value.

I'd keep an eye on whether fair value and market stabilization occur around any of the following ratio levels, namely 150, 100, 80, or 60

A drop and hold below 60 would be catastrophic for the SPX and could send it plunging to 2500, or lower.

President Biden's two-hour question and answer session with the press on January 19 did absolutely nothing to stabilize the markets.

I won't bore you with the details. Many others have reported on his disastrous answers and performance...true to form, it wasn't pretty.

If you want to see for yourself, you can view the video link below.


Monday, January 17, 2022

Death Cross Forms On SPX:VIX Ratio

I last wrote about the SPX in my 2021 Market Wrap-Up and 2022 Forecast on January 1.

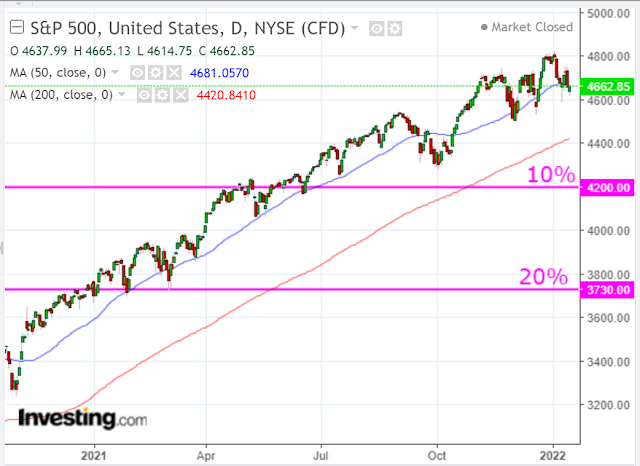
The SPX closed (around 20 points below the 50-day moving average) at 4662.85 last Friday, as shown on the following daily chart. The 200-day moving average is well below at 4420.84, which is slightly above the yearly Pivot Point for 2022 of 4412.61 (identified in my above-mentioned post). Both moving averages are still in uptrend.

The SPX uptrend is wavering and price is caught in a large and tightly bunched-up consolidation range.


A 50/200-day moving average Death Cross just formed on the SPX:VIX Ratio, as shown on the daily ratio chart below...at variance with the moving averages on the SPX.

It's a warning signal that weakness has crept into the SPX and we may see it pull back or correct soon.

A 10% drop would send it down to 4200, while a 20% drop would take it to 3730.

Alternatively, it may be a bear trap.

These two scenarios should become more clearly defined after the next Fed meeting on January 26.

In the meantime, trading will likely remain volatile and whippy...especially below 4700.


Saturday, January 01, 2022

2021 Market Wrap-Up and 2022 Forecast

My 2020 Market Wrap-Up and 2021 Market Forecast can be found at this link.

After witnessing an unusual number of wild parabolic spikes and plunges on a variety of trading instruments during 2021, I'd posit that 2022 will see a return to a state of quasi-rationality... out of necessity in order to preserve one's remaining stash of cash

BUT, this will create higher volatility, lower volumes, lower trend sustainability, longer periods of consolidation, lower expectations, and lower certainty, overall.

2022 will be hung over with higher (persistent) inflation, COVID-19 variants and accompanying economic disruptions, increased interest rates, a changing political landscape, increasing national and international security concerns, and a skyrocketing national debt, to name a few headwinds.

In fact, it may very well feel like market makers/movers and shakers have you "on hold" at times.

There will be surprises, some quite shocking (to markets) if/when they become common knowledge.

"Don't think money does everything,
or you are going to end up
doing everything for money."
-- Voltaire

At its height, the SPX gained around 29.5% for 2021. Assuming we do see quasi-rationality take hold, we could expect to see a gain of around half of that in 2022 -- a 16%+/- increase by year end -- IF the tailwinds outweigh the headwinds

Its trading range for 2021 was 1,146.22 points, with a high of 4808.93 and a low of 3662.71, as shown on the following yearly chart.

The following Pivot Point calculations are provided to illustrate a variety of support and resistance levels/price targets on the yearly timeframe for the SPX. They are based on the high/low/close of the 2021 candle for 2022's levels/price targets.

The Pivot Point of 4412.61 for 2022 (identified below) is one and the same as the Pivot Point depicted on the 2021 yearly candle in the chart above (small horizontal white line). It will act as a major support/resistance level for 2022, with R1/R2/R3 acting as minor resistance and S1/S2/S3 acting as minor support levels.

If the SPX sees a gain of around 16% for 2022 from 2021's close of 4766.18, it may reach a high of 5528.80. That price is just 30 points shy of the R2 target at 5558.83.

However, if it falls and holds below the Pivot Point at 4412.61, we could see a catastrophic plunge ensue in the equity markets...and markets worldwide.

In conclusion, look for more stable and valuable sectors and stocks, commodities, bonds, and currencies which, potentially, may act as a safer hedge against the headwinds (and, as yet, unrevealed shocking surprises) described above.

BUT, keep your wise wits about you!

"If there is no wisdom,
rationality can be very dangerous."
-- Nirmala Srivastava

~~~~~~~

Happy New Year and best of luck in 2022!

~~~~~~~

* UPDATE January 5...

It appears that the Fed is confirming many of my 2022 "hangover" assessments, as outlined in their minutes released today from their last meeting. 

As I write this update at 2:30 pm ET, the SPX is currently selling off, but remains above the upper edge (4700) of a sideways consolidation zone that began last November...now considered minor support

A drop and hold below 4700 will see a return to a trendless, whippy and volatile market until it breaks and holds below 4500.


* UPDATE January 7...

The US 10-year treasury yield (US10YT) has spiked upward since the beginning of this year, as shown on the monthly chart below...confirming Fed sentiment described above.

It's now well above major support of 1.50 and is on its way to 2.00...or higher.

And, there's this report pertaining to yields...

* UPDATE January 8...

The following article provides a good explanation of how we got to the point of inflation headaches for the Fed...and where things are headed...(HINT: bad news for consumers)...

* UPDATE January 12...

Inflation has gone vertical over the past two years, as has the SPX...looks like a correlation to me.

CPI (Consumer Price Index) came in at 7.0% today.

By the way, inflation has spiked way above what it was just prior to the 2008/09 financial crisis.

If that's not a warning to traders, I don't know what is! 😕

And, it's bad news for President Biden and his far-left spending agenda/spree. 

So, what will he do for the next three years of his first term that will benefit all Americans?

Unless he shifts radically away from his socialist agenda and unconstitutional mandates and moves toward a centrist stance, he will be hamstrung by factors such as spiking inflation and plummeting poll numbers (currently in the low 30s).

So, brace yourselves for stagflation until the 2024 election.


Zerohedge excerpt


Tuesday, February 23, 2021

S&P 500 Index Monthly Pivot Points For February 2021

The following pivot point calculations and chart are provided to illustrate a variety of support and resistance levels/price targets on the monthly timeframe for the S&P 500 Index (SPX).

The calculations below are based on the high/low/close of January's candle for February's levels/price targets.


The following monthly chart of the SPX shows that price nearly hit R2 (3957), so far, this month. 

There are only three trading days left; however, we might see a final push up to somewhere in between the 1.50% external Fibonacci level at 3994 and R3 at 4044.

However, a drop and hold below R1 at 3835 may see price drop to somewhere around the PP at 3749, or lower.


Wednesday, August 12, 2020

SPX Pivot Point Values for August 2020

The pivot point support/resistant values/targets for the S&P 500 Index (SPX) for the entire month of August are based on the high/low/close of the July monthly candle, as shown on the following pivot point calculator.

The PP of each monthly candle is depicted as a blue cross on the chart of the SPX below.

You can see, at a glance, where the current price is relative to those...giving an indication as to its relative strength/weakness as the price moves above/below each one in the coming days/weeks/months.

The July candle closed on Friday, July 31. At that time, there was only one more PP to overcome...that of the January candle at 3259.31. As of Tuesday's close of the new August candle, it's well above all previous monthly PPs.

R1 sits at 3333.79...Tuesday closed just below at 3333.69...after hitting a high of 3381.70 (just under R2 at 3396.46).

The Balance of Power has been declining since May. It was hovering just above the zero level at the close of the July candle...signalling a potential weakness or lack of conviction in the buying in the ensuing months.

Near-term support sits, firstly, at January's PP at 3259.31, then July's PP at 3217.12. A drop and hold below that level may see price reach S1 at 3154.45, or lower. 

A 10% correction from the recent high would see the SPX reach somewhere around 3,043.53...S2 sits at 3037.78, so that's possible.

The SPX:VIX ratio dropped back below 150, after briefly breaking above and retesting the 200 MA, as shown on the following daily ratio chart.

The RSI is threatening to break its recent uptrend, but is still above 50. Both the MACD and PMO indicators are about to form bearish crossovers.

If the RSI breaks and holds below 50, and if the MACD and PMO form bearish crossovers, we may see price retest the 50 MA around 115, or lower to the next major support at 100...all as confirmation that the SPX may drop to its July PP, S1, or even correct by 10% down to S2.

However, if the SPX breaks back and holds above R1 (3333.79), it may retest or overshoot its all-time high of 3393.52. R2 sits at 3396.46

Then, the next major resistance level (R3) is much higher (with only air in between) at 3513.13...so we'd be in for one heck of a bear surprise if that were reached!

I'd venture a guess that things are going to get "interesting" (volatile) this week...one way or the other!


Saturday, July 18, 2020

SPX Pivot Point Values for Week of July 20

The pivot point support/resistant values/targets for the S&P 500 Index (SPX) for the week of July 20 are based on the high/low/close for the July 13 weekly candle, as shown on the following pivot point calculator.


The PP of each weekly candle is depicted as a blue cross on the weekly chart of the SPX below.

You can see, at a glance, where the current price is relative to those...giving an indication as to its relative strength/weakness as the price moves above/below each one in the coming days and weeks.

On Friday, it closed above the PP for the July 20 week and only remains below the PPs of the weeks of December 23 to February 17...which represents relatively minor resistance, considering that it fought through all of 2018, most of 2019, and most of the 2020 overhead resistance since the March low.

R1 sits at 3265.94 and S1 at 3155.78, which represent near-term resistance and support levels or targets. 

If the SPX holds above this week's PP of 3196.99, there's a good chance it will reach R1, or higher; otherwise, a drop and hold below it could see it hit S1, or lower.


Volatility has dropped off the past couple of weeks, as the SPX:VIX ratio broke above the 100 level, once more, as shown on the following daily ratio chart.

Its target is the 200-day moving average around the 150-155 level, which converges with the next level of major price resistance.

The RSI, MACD and PMO technical indicators are all bullish, so look for that to continue in order to confirm any further sustainable rally on both the SPX:VIX ratio and the SPX

Otherwise, any hesitation or reversal on these would not bode well for SPX buyers...particularly if the SPX drops and holds below the PP at 3196.99, and, especially, if the Balance of Power flips from buyers to sellers on the weekly timeframe (falls and remains below zero).


Saturday, May 30, 2020

SPX Pivot Point Values For June

MAY'S PERFORMANCE


Further to my post of May 25, the SPX didn't quite reach its potential R1 target of 3095.86 for the month of May. Rather, it hit a high of 3068.88 by month's end and was just 24.57 points shy of that level, as shown on the following monthly chart. It did, however, reach and exceed that level (3 trading days later) on June 3 (3131.40).

However, in my post of May 17, I gave the SPX a 55% chance of moving higher, when its price was 2863.70. Since then, it gained 205.18 points in nine trading days into the end of May.

So, all in all, I'd have to say that the the bulls were a little more than 55% successful in moving this market higher, even though it didn't quite make its R1 target.

JUNE TARGETS


The pivot point support/resistant values/targets for the S&P 500 Index (SPX) for the entire month of June are based on the high/low/close of the May monthly candle, as shown on the following pivot point calculator.


The PP of each monthly candle is depicted as a blue cross on the chart of the SPX below.

You can see, at a glance, where the current price is relative to those...giving an indication as to its relative strength/weakness as the price moves above/below each one in the coming days/weeks/months.

As of Friday's close, it's well above March, April and May's PP and pierced through February's PP of 3067.86. Price has fought through all of 2018, half of 2019, and well over half of 2020's overhead resistance since the March low, with relatively less (and recent) overhead resistance left to overcome.

R1 sits at 3153.3066, which, together with February's PP of 3067.86, will act as near-term resistance, as well as targets.

The closer the SPX gets to its all-time high at 3393.52, the nearer the Balance of Power will reach an overbought condition. However, that does not automatically mean that it will sell off at that point or that the price can't go much higher. Rather, it may just continue to rally more slowly over time.

Near-term support sits at May's PP at 2959.8833. A drop and hold below that level may see price reach S1 at 2850.8866, or lower.


SUMMARY


We may see, either a pause in direction, or some profit-taking on Monday and beyond, as the markets digest the effects of this past week's riots in Minneapolis and St. Paul, and other cities across America...particularly, with respect to the damages caused to many businesses, as they were set to open in June after the COVID-19 pandemic months' long shutdown.

I hear that many more riots are planned for tonight (Saturday) in at least 50 cities. Who knows if this will spread to other countries, as they're also trying to rebuild their economies caused by the global pandemic...we'll see what happens.

SUNDAY AFTERMATH...CARNAGE...ANARCHY


This link will provide Sunday's update on the violence and mayhem that occurred in the rioting, destruction and looting last night.

Monday, May 25, 2020

SPX Target: 3100 By May 29

* See UPDATES below...

My post of May 21 identified a pivot point resistance value/target (R1) of 3095.86 for the S&P 500 Index (SPX) for the month of May.

Its S&P 500 E-mini Futures Index counterpart (ES) has almost touched the 3000 level in Monday evening's trading session, as shown on the following daily chart.

There are four trading days left in May for the SPX to reach its R1 value, which coincides with the next technical resistance level of around 3100 for the ES (the median of an uptrending channel converging with overhead price resistance).

The Balance of Power lies with the buyers and Momentum is still on the rise, so I'd give it a 55% chance of making that target...we'll see what happens.

The last time I gave the SPX a 55% chance of moving higher, it was about 100 points lower on May 17, so I'll stick with that percentage for now.


* UPDATE May 30...

The SPX didn't quite reach its potential R1 target of 3095.86 for the month of May. Rather, it hit a high of 3068.88 by month's end and was just 24.57 points shy of that target, as shown on the following monthly chart.

However, in my post of May 17, I gave the SPX a 55% chance of moving higher, when its price was 2863.70. Since then, it gained 205.18 points in nine trading days into the end of May.

So, all in all, I'd have to say that the the bulls were a little more than 55% successful in moving this market higher, even though it didn't quite make its R1 target.


* UPDATE June 3...

The SPX finally reached my 3100 target today, albeit, three day's late, as shown on the following daily chart. In fact, it blew right through it to reach a high of 3131.40.

Its next support and resistance levels/targets are outlined in my post of May 30.

It looks like my crystal ball is in need of an upgrade. 😉


Thursday, May 21, 2020

SPX Pivot Point Values For May

The pivot point support/resistant values/targets for the S&P 500 Index (SPX) for the entire month of May are based on the high/low/close of the April monthly candle, as shown on the following pivot point calculator.


The PP of each monthly candle is depicted as a blue cross on the chart of the SPX below.

You can see, at a glance, where the current price is relative to those...giving an indication as to its relative strength/weakness as the price moves above/below each one in the coming days/weeks/months.

As of Wednesday's close, it's well above March and April's PP and below January and February's PP. Price has fought through all of 2018, half of 2019, and well over half of 2020's overhead resistance since the March low, with relatively less (and recent) overhead resistance left to overcome.

R1 sits at 3095.86, which is slightly above the PP for February's candle at 3067.86. Both of these price levels will act as near-term resistance, as well as targets.

The closer the SPX gets to its all-time high at 3393.52, the nearer the Balance of Power will reach an overbought condition. However, that does not automatically mean that it will sell off at that point or that the price can't go much higher. Rather, it may just continue to rally more slowly over time.

Near-term support sits at April's PP at 2771.67. A drop and hold below that level may see price reach S1 at 2588.25, or lower.


Sunday, April 05, 2020

SPX Pivot Point Values For April

The pivot point support/resistant values/targets for the S&P 500 Index (SPX) for the entire month of April are based on the high/low/close of the March monthly candle, as shown on the following pivot point calculator.


The PP of each monthly candle is depicted as a blue cross on the chart of the SPX below.

You can see, at a glance, where the current price is relative to those...giving an indication as to its relative strength/weakness as the price moves above/below each one in the coming days/weeks/months.

As of Friday's close, it's above the PP of the August 2017 candle and below all subsequent ones. A great deal of price resistance lies above, as well as an unfilled gap for April's candle.

I'm not confident that we'll see any convincing and sustainable strength arise anytime soon...due to the global crisis caused by the covid-19 pandemic.


However, volatility has abated somewhat recently, as depicted on the following SPX:VIX daily ratio chart.

All three RSI, MACD and PMO technical indicators are rising, but price is still below 60.00...a major price resistance level that must be recaptured and held if the SPX is going to have any chance of a recovery soon.

Otherwise, failure to do so, will likely mean lower prices in the coming days/weeks for the SPX, inasmuch as such high volatility levels are not the norm and are usually only sustained during periods of extreme economic and financial instability.

In any event, we'll likely see wild volatile swings in both directions until such time as the price on this ratio returns to, at least, the 200 level.


Saturday, March 14, 2020

S&P 500 Index Daily, Weekly & Monthly Pivot Points

* See UPDATES below...

Further to my last post, the following pivot point calculations and charts are provided to illustrate a variety of support and resistance levels for three timeframes, namely daily, weekly and monthly, for the S&P 500 Index (SPX).

For a detailed explanation of pivot points, feel free to check out John Person's website at this link (the creator of this pivot calculator) and use his calculator for your own purposes. Just input the respective candle's high, low and close values to the second decimal point and press "submit."

Generally speaking, it uses the prior day's, week's, or month's high, low and close to calculate the following day's, week's, or month's Pivot Point (PP) and its resistance values above and its support values below. Price action above the PP is considered bullish, and below, it's bearish.

 SPX Daily Pivot Point Values (for Monday March 16)

SPX Weekly Pivot Point Values (for the WEEK of March 16)

SPX Monthly Pivot Point Values 
(taken from the MONTH of February for March)

For a quick way to view the PP (pivot point) of each timeframe, I've shown it in a one-period moving average (hlc3) cross format (blue) on each of the following daily, weekly, monthly, and last monthly charts.

Friday the 13th closed at 2711.02.

So, for example:

  • The daily PP for Monday March 16 is 2638.24 -- N.B. Friday closed above that value, as well as Thursday's PP at 2540.15, so it closed bullish on the day, as well as compared with the prior day.
  • The weekly PP for the week of Monday March 16 is 2687.4833 -- N.B. Friday closed above that value, so it closed bullish for the week, but still bearish below the prior week's PP at 3003.5434.
  • The monthly PP taken from February for March is 3067.86 -- N.B. Friday closed well below that level, so it is bearish on the prior month, so far. ***(NOTE that March's PP is currently 2772.7333, based on this month's trading action, thus far, and will change before month's end, the final value to be used for trading in April -- N.B. Friday closed below that value, so it is bearish on the current month, so far.)


SPX Daily chart 

 SPX Weekly chart

SPX Monthly chart 

I've included the following longer-term screenshot of the monthly price action of the SPX for the 21st century.

Shown on all of the four charts is the Average True Range (ATR) indicator with an input value of one period in histogram format to highlight extreme ranges, in particular.

The massive spikes in the February and March ATRs (on the monthly charts) have been unparalleled in range. They either represent capitulation or near capitulation that could produce a hefty bounce, or extreme fear that could continue to send the SPX plunging even further down.

I would hope that large-scale global monetary and fiscal stimulus measures that are currently being considered and/or taken by world central banks and governments would begin to calm markets down soon.

Hence, my providing the above daily, weekly and monthly pivot point support and resistance levels for possible tools to use in gauging market direction and strength for the SPX, as well as a Fibonacci retracement study taken from the December 2018 low to the February 2020 high (which also provides support and resistance levels within that trading range).

We may see price whipsaw within this 1,046.94-point trading range for quite awhile, until it stabilizes and eventually begins a new rally.

A drop and close below the low of the range could see catastrophic selling to the S1, S2 or S3 levels noted on the above three pivot point calculators.

Note that the Daily S3 level for Monday is 2346.19...virtually at the bottom of this range.

As an aside, I mentioned 2750 as a level of some importance on the corresponding S&P 500 E-mini Futures Index (ES) in my last post. It happens to coincide, roughly, with the SPX 60% Fibonacci retracement level of the trading range, R1 on the daily calculator, S1 on the monthly calculator, and the current PP of the March candle. It's not that far above Friday's closing price, so we may see some action around it on Monday.

SPX Monthly chart (21st Century)

In any event, volatility is likely to remain extremely elevated in both directions for awhile, until we eventually see a new series of higher swing highs and lows form on the SPX daily timeframe.

The following SPX:VIX daily ratio chart shows that price is still well below 60 (at levels seen during the peak of the 2008/09 financial crisis), as well as 100. I'd like to see it recapture and hold above 100, at least, before considering the possibility that volatility is settling down somewhat.

Furthermore, price is under the bearish influence of a recently re-formed moving average Death Cross, the RSI has yet to retake the 50 level, and the MACD and PMO indicators have yet to form bullish crossovers. So, we'll need to see reversals of those occur and hold, if price rallies to anywhere near 100, and beyond...and, if the SPX can retake and hold above 2750 and higher.

Otherwise, look out below!

SPX:VIX Daily Ratio chart

* UPDATES...

The S&P 500 E-mini Futures Index (ES) nearly tagged the SPX S3 level of the Daily Pivot Point calculations for Monday March 16 (see above). It made a low of 2350.88, while the SPX low was 2364.55.

Each candle on the following S&P E-mini cash chart represents a period of one quarter.

As of Monday's close, the current candle, Q1 of 2020, is a massive bearish engulfing candle and it has erased nearly all of the preceding trades since Q2 of 2017.

I've shown an ATR overlay on the chart (Average Trading Range), with an input value of one period (one quarter) to show the excessively and unprecedented extreme level it has now reached. As I mentioned above, this either represents capitulation or near capitulation that could produce a hefty bounce, or extreme fear that could continue to send the SPX plunging even further down.


So far, in spite of recent moves by various world central bankers and treasury departments, markets around the world continued to plummet on Monday, as shown on the following charts. Their respective percentages lost to date from February 19 are shown on the following graph.

It remains to be seen what global monetary and fiscal stimulus measures, as well as health conditions related to the coronavirus pandemic, are necessary before world markets begin to stabilize.

In any event, the above Pivot Point calculations for the Week and Month are still valid as support and resistance levels/targets for the SPX...ones to watch for the rest of this week.


N.B.

The SPX pivot point support and resistance values for Tuesday are:


The SPX pivot point support and resistance values for Wednesday are:


The SPX pivot point support and resistance values for Thursday are:


The VIX pivot point support and resistance values for Thursday are:


The SPX pivot point support and resistance values for Friday are: