WELCOME

Welcome and thank you for visiting!

The charts, graphs and comments in my Trading Blog represent my technical analysis and observations of a variety of world markets...
* Major World Market Indices * Futures Markets * U.S. Sectors and ETFs * Commodities * U.S. Bonds * Forex

N.B.
* The content in my articles is time-sensitive. Each one shows the date and time (New York ET) that I publish them. By the time you read them, market conditions may be quite different than that which is described in my posts, and upon which my analyses are based at that time.
* My posts are also re-published by several other websites and I have no control as to when their editors do so, or for the accuracy in their editing and reproduction of my content.
* In answer to this often-asked question, please be advised that I do not post articles from other writers on my site.
* From time to time, I will add updated market information and charts to some of my articles, so it's worth checking back here occasionally for the latest analyses.

DISCLAIMER: All the information contained within my posts are my opinions only and none of it may be construed as financial or trading advice...please read my full Disclaimer at this link.

Dots

* If the dots don't connect, gather more dots until they do...or, just follow the $$$...

Paris Cafe

Paris Cafe

ECONOMIC EVENTS

UPCOMING (MAJOR) U.S. ECONOMIC EVENTS...

***2026***
* Wed. July 29 @ 2:00 pm ET - FOMC Rate Announcement + Forecasts and @ 2:30 pm ET - Fed Chair Press Conference

*** CLICK HERE for link to Economic Calendars for all upcoming events.

Showing posts with label Japan's Nikkei Index. Show all posts

Saturday, September 24, 2022

GLOBAL MONEY FLOW: Cash & Crash

I've written a number of posts in the last few months regarding the MSCI World Index and the SPX, several of which are here and here, respectively, (together with subsequent updates) warning of further market crashes.

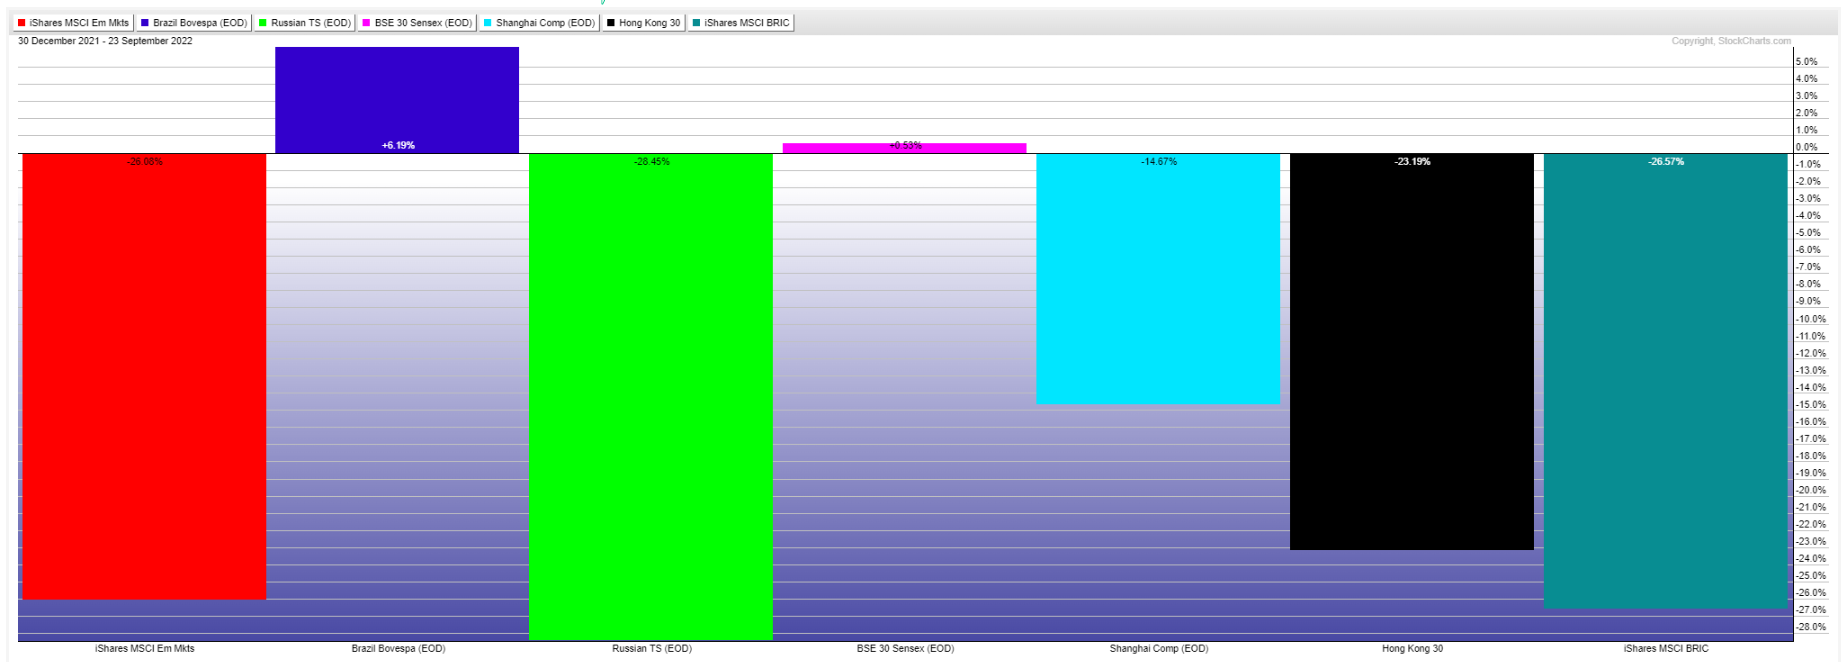
The following Year-to-Date and One-Week Percentages Lost/Gained graphs clearly depict, at a glance, global money flow for 2022 and for the past week (graphs courtesy of StockCharts.com).


MONEY FLOW YEAR-TO-DATE


U.S. Major Indices

U.S. Major Sectors

European Major Indices

Canada, Japan & Australia Major Indices

Emerging Markets ETF, BRIC Major Indices & BRIC ETF

Commodity & Agriculture ETFs & Commodities

Currencies, BITCOIN, XLF, EUFN & GXC

MONEY FLOW SEPT. 19-23


U.S. Major Indices

U.S. Major Sectors

European Major Indices

Canada, Japan & Australia Major Indices

Emerging Markets ETF, BRIC Major Indices & BRIC ETF

Commodity & Agriculture ETFs & Commodities

Currencies, Bitcoin, XLF, EUFN & GXC

SUMMARY

Overall, the biggest winners have been:

  • the Oil and Gasoline sectors, 
  • as well as the U.S. Dollar.

The biggest losers have been:

  • Bitcoin, 
  • global equities (especially U.S., China, Russia, Europe and the emerging markets ETF, EEM), 
  • global Financial ETFs (U.S., Europe & China), 
  • foreign currencies, 
  • U.S. Bonds, 
  • copper & precious metals, and
  • U.S. Discretionary, Technology, Materials and Financial Sectors.

During the past week, there has been:

  • continued buying of the U.S. Dollar, 
  • continued selling of Bitcoin, 
  • some selling in Oil and Gasoline,
  • accelerated selling of the British Pound, the Euro, Aussie Dollar and Canadian Dollar,
  • accelerated selling of the U.S., European and Chinese Financial ETFs (XLF, EUFN and GXC), and
  • accelerated selling of global Major Indices (including U.S.), and U.S. Major Sectors.


CONCLUSIONS

All in all, I see no pivot away from U.S. Dollar strength and global equity and sector (and Bitcoin) weakness...YET.

So, for the moment, U.S. cash is king, as the U.S. Fed has signalled its intent to continue raising interest rates and keep them elevated for some time after inflation has declined to the Fed's 2% maximum inflation target...which could last well into 2025.

*********

P.S. After I published this post, I came across the following article...which, interestingly, confirms my conclusions...

And, more analysts' opinions...


Monday, March 29, 2021

Japan's Nikkei 225 Buyers Drying Up

* See UPDATE below...

It looks like the buying in Japan's Nikkei 225 (JP225) began drying up in December, 2020, according to the Balance of Power indicator shown on the following monthly chart.

A drop and hold below 29,000 could see price drop rapidly to 24,000, or even 20,000.

Precisely what catalyst could cause such a sharp, swift selloff remains to be revealed.


* UPDATE March 30...

Catalyst?...


Wednesday, November 23, 2016

China's Shanghai Index: Its Role in World Markets in 2016

I last wrote about China's Shanghai Index (as part of a comprehensive review of major world markets) on January 29th. Since then, and, until June, the road to recovery from its lows of the year has been volatile and rocky. The last half of this year has seen a fairly steady, if choppy, advance to its current level just below its next resistance level of 3250, as shown on the following Daily chart.

In that post, I had mentioned that a rally to (and hold above) 3000 could thwart a major downdraft, as was being threatened by an imminent break of a neckline of a massive Head & Shoulders formation.

A break and hold above 3250 could see price continue to rally to its next resistance level around 3400-3500. This index is trading under the bullish influences of a moving average Golden Cross, so a break and hold above 3250 is critical to continued success of further advance; otherwise, a drop and hold below that level could very well see a major bear attack ensue, sending price to new lows of around 2500, or more.


In my above-mentioned post, I also made the following conclusion (relative to world markets):
     "In particular, watch Japan, China, Brazil, the Russell 2000 and the Nasdaq 100 Indices for committed leadership..." related to any real success or failure of the S&P 500 Index and equities, in general.

As noted on the following 1-year Daily charts of these indices, they've all risen above major consolidation/congestion levels this year, with the exception of the Nasdaq 100...the one to watch, along with the Shanghai Index, to see whether their movements (either strength or weakness) influence, or have an impact on, the other indices in the days and weeks ahead.


Tuesday, February 02, 2016

Nikkei Index Teeters on the 2007/08 Brink

*See UPDATE below...

Japan's Nikkei Index is currently trading just above the 17,000 level as I write this post around 9:00 pm ET Tuesday and is down around 3.3% from yesterday's close. You can see from the Monthly chart below that this is around the same level just before the 2007/08 crash.


A drop and hold below 17,000 could spell another big plunge in this index and confirms what I mentioned in my post of January 29th. If it holds, this "island reversal" candle formation on the Daily chart below should produce some "interesting" results!


*UPDATE February 9th:

The above bearish "island reversal" candle formation has been confirmed. After last night's 918.86 point drop, the Nikkei Index now sits just above 16,000, as shown on the following Monthly chart.

Major support sits at 14,000, followed by 12,000.


At the moment (10:05 am ET), the USD/JPY Forex pair is trading at 115.22, as shown on the following Monthly chart.

Major support lies far below at 110.00, followed by 100.00.


The recent extreme moves in both the Nikkei Index and the USD/JPY Forex pair tells me that volatility is not yet over, and, in fact, may have just begun.

Friday, January 29, 2016

It's Now or Never For Bulls

Was today's (Friday's) world-market rally serious and sustainable, or simply a knee-jerk reaction to Japan's surprise NIRP (negative interest rate policy) announcement last night (including some shorter-term short-covering action) and "end-of-month window dressing" by fund managers?

Perhaps the following update to my last post will provide some further insight into that question, as I review a variety of markets.

Thursday, January 28, 2016

Thurs. Jan. 28/16: Possible Bull Trap Today

*SEE UPDATES BELOW...

As at the time of writing this post (9:45 am ET), the Daily Heikin Ashi candles on the E-mini Futures Indices (YM, ES, NQ, TF & NKD) are hinting that today's rally may be a bull trap...I'll post an update after today's close.


*UPDATE (after Thursday's close):

Here's how these E-mini Futures Indices closed today. The Daily Heikin Ashi candle chartgrid below shows a lack of conviction or strength, at this time, on the part of buyers. In months past, we'd normally see a V-shaped bounce on this type of candle chart, with a decent rally following...but such is not the case now.


A look at the Weekly Heikin Ashi Candle chartgrid below shows, that on a weekly basis, no reversal pattern is yet seen.

I'll post another update after tomorrow's close to see how this week's candle closes.


I last wrote about the SPX:VIX ratio in my post of January 13th. The Monthly ratio chart below of SPX:VIX shows that price bounced a bit since then, and is now stuck in, what I've called the "Uncommitted Zone."

Until we see a move (with conviction) above (which stays above) the 100 Bull/Bear Line-in-the-Sand level, we'll continue to see whippy, volatile moves, which lack direction...or even see the next major plunge in the SPX and equities, in general. The Momentum indicator is still below zero on this timeframe...I'll need to see it pop above (and stay above) zero on any rally to confirm buyer conviction.

I'll post another update after tomorrow's close to see how this month's candle closes.


***N.B. This stunning announcement Thursday evening by the Bank of Japan to cut interest rates into negative territory immediately sent world markets and currencies roiling overnight...Japan's Nikkei Index made several harrowing round-trip spikes, totaling approximately 2,180 points! I'll post more on the effects on markets after Friday's close.


*UPDATE (as of Friday @ 10:30 am ET):

World markets rallied overnight and North American equities continue the bounce, as noted below (more later)...

Source: www.indexq.org

*N.B. See my next UPDATE at this link.

Thursday, October 08, 2015

Death Cross Formation on Japan's Nikkei Index

Notwithstanding the bearish moving average Death Cross that has now formed on the Japanese Nikkei Index, all three indicators are hinting of higher prices, as shown on the 5-year Daily chart below.

At the moment, major resistance sits at 19000, while minor support is at 17000, with major support at 16000. I'd watch the RSI, in particular, to see whether it can rise (and stay) above the 50.00 level. If so, we may see price spike to 19000 before consolidating -- then, either, attempt to penetrate above (and reverse) the moving average cross-over and rally to, potentially, new highs, or drop to new lows around the 16000 level. Otherwise, a hold below 50.00 on the RSI may see price plunge as low as 16000 (or lower), first.


Saturday, September 05, 2015

Will Japan & China Lead Markets Back Up?

How strong is Japanese influence on U.S. markets?

Will the Shanghai Index regain strength on Monday?

Without U.S. markets opening until Tuesday, we may see an attempt by Japan's Nikkei Index and China's Shanghai Index to bounce somewhat. It may not become clear until Tuesday's close as to the potential strength of any sustainable rally in these Indices, along with the S&P 500 Index. Furthermore, there are quite a lot of economic reports being released on Monday for Japan and China, which may influence Tuesday's trading.

I'd keep a close eye on these three Indices, along with the USD:JPY forex pair, which have all traded lock-step (as shown on the following 1-Year Daily comparison chart), as to which direction the next (sustainable) breakout will occur.


Saturday, November 01, 2014

Japan's Nikkei...Into The 2007/08 Froth

After the Bank of Japan's policy announcement on October 31st to increase the amount of money they're pouring into the markets (including U.S. markets), the Nikkei Futures Index soared and ended the week just above major resistance (around 16,666) and is back into the 2007/08 froth, as shown on the Weekly chart of the NKD below.

Failure to hold this level (which is, no doubt, an important psychological level to surpass), could see this index slip back to 15,000, 13,700, or even 12,600 (as I discussed in my post of  October 12th) before they step in and prop it up, once more. Daily volumes may hold the key to direction in this regard...former buying from November of 2013 was thin and resulted in "dead-cat-bounces."


Sunday, August 07, 2011

Japan's Nikkei 225 Futures Index (NKD) at March 2009 Levels

Japan's Nikkei 225 Futures Index (NKD) opened down tonight at 9150 and is currently trading at 9125...a level that it was trading at by the end of March 2009 as shown on the Weekly chart below. A solid break and hold below this level, and below the pivot point of the March 14, 2011 weekly candle at 9092, would have me concerned about any short-term value in this futures index...I wouldn't be surprised to see the YM, ES, NQ & TF follow a further move downward (from tonight's open and lows so far) if that were to happen on the NKD.