WELCOME

Welcome and thank you for visiting!

The charts, graphs and comments in my Trading Blog represent my technical analysis and observations of a variety of world markets...
* Major World Market Indices * Futures Markets * U.S. Sectors and ETFs * Commodities * U.S. Bonds * Forex

N.B.
* The content in my articles is time-sensitive. Each one shows the date and time (New York ET) that I publish them. By the time you read them, market conditions may be quite different than that which is described in my posts, and upon which my analyses are based at that time.
* My posts are also re-published by several other websites and I have no control as to when their editors do so, or for the accuracy in their editing and reproduction of my content.
* In answer to this often-asked question, please be advised that I do not post articles from other writers on my site.
* From time to time, I will add updated market information and charts to some of my articles, so it's worth checking back here occasionally for the latest analyses.

DISCLAIMER: All the information contained within my posts are my opinions only and none of it may be construed as financial or trading advice...please read my full Disclaimer at this link.

Dots

* If the dots don't connect, gather more dots until they do...or, just follow the $$$...

Paris Cafe

Paris Cafe

ECONOMIC EVENTS

UPCOMING (MAJOR) U.S. ECONOMIC EVENTS...

***2026***
* Wed. July 29 @ 2:00 pm ET - FOMC Rate Announcement + Forecasts and @ 2:30 pm ET - Fed Chair Press Conference

*** CLICK HERE for link to Economic Calendars for all upcoming events.

Showing posts with label Capitulation. Show all posts

Monday, October 24, 2022

Chaos In China's Hang Seng Index

* See UPDATE below...

In my post of March 14, I described a scenario where a drop and hold below 20,000 on China's Hang Seng Index (HK50) could see it plunge to 16,000, or lower.

It, subsequently, swirled around that level, finally closing below at the end of August, as shown on the following monthly chart.

It has since plummeted and closed on Monday at 15,180.69...losing 6.3% on the day.

Sellers are in control, as downside volatility is increasing.

Should price remain below 20,000, it could easily drop to 12,000, or even lower to 8,000.

Monday was a bad day for all Chinese indices.

There are numerous major issues, with which China is grappling, including their property market, technology sector, zero COVID-19 policies, inflation, currency, support for Russia in their war with Ukraine, etc.,...none of which can be readily resolved...and none of which would be attractive to new foreign investment.

The following article describes some of those.

N.B. Further China weakness may drag other world markets (or their financial institutions) lower, if they are already heavily invested, directly or indirectly, in any of those markets. 

So, bear in mind the remarks I made in my post of October 22.

* UPDATE Oct. 29...

The Hang Seng Index lost further ground this past week...opening below 16,000 and closing at 14,863.06.

It closed below the bottom of a long-term uptrending channel the prior week around the 16,500 level, as shown on the following monthly chart.

Any sustainable rally over the coming weeks will need to see it retake and hold above, firstly, 16,000, then 16,500...for a possible retest of 20,000

Otherwise, it could easily plunge to 12,000, or, even, 8,000.

Correspondingly, the Shanghai Index (SSEC) is caught in a narrow band within a large matrix (between 3,000 and 2,840), as shown on the following monthly chart.

It's had difficulty remaining above 3,550 since January 2007, which is a formidable long-term resistance level (and part of a significant future apex within this matrix...forming roughly in April 2029).

Failure to convincingly retake and hold above 3,000, could see it plunge to 2,500, or, even, 2,000.

For now, China weakness continues.

* UPDATE Nov. 27...

From the following report, it's clear that the China boom of the 1990s, then the 2000s, has been badly damaged, as shown on the monthly chart of the Hang Seng Index (HK50) below.

HK50 has failed to continue with the upward trajectory and pace of those decades, evident by the break and plunge below the longterm rising channel this year.

Furthermore, HK50 has struggled to remain and gather strength above 20,000 for the past 16 years.

I find it hard to believe that China will regain its former glory any time soon, if ever, (a) for the reasons cited in the report, (b) for the aforementioned charting reasons, as well as, (c) the fact that world countries are moving away from their previous reliance on cheap Chinese goods in favour of domestic product development and production.

As such, I anticipate that HK50 will be locked in a large sideways trading range for some time -- complete with volatile whipsaw price action -- between 12,000 and 20,000.


Saturday, October 22, 2022

WORLD MONEY FLOW: October Week 3, 2022

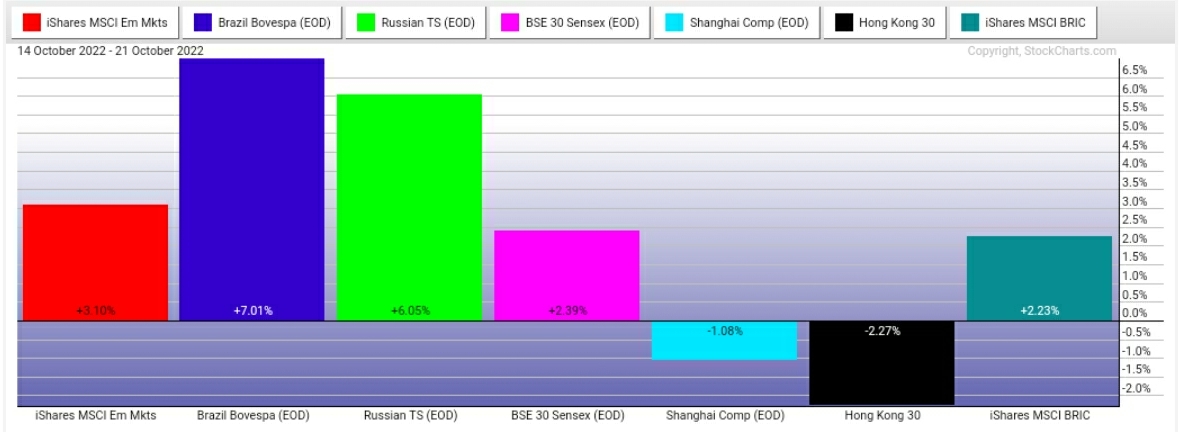
The following graphs depict percentages gained/lost world-wide for the third week of October for a variety of major world indices, sectors, commodities, currencies and banks.

US Major Indices

US Major Sectors

European Major Indices

Canada, Japan & Australia

EEM & BRICs

Agriculture & Commodities

Currencies, US Bonds, Bitcoin, XLF, EUFN & GXC

Major Banks

At a glance, traders favoured:

  • high-risk versus low-risk assets (growth over value),
  • US markets versus Europe and Canada,
  • the Energy sector, particularly Brent Crude Oil,
  • Brazil and Russia,
  • Gasoline,
  • Silver, Platinum and Copper,
  • the Aussie and Canadian Dollars, and, to a lesser extent, the Euro and British Pound Sterling,
  • US and European Financial ETFs, and
  • major banks (perhaps bank buy-backs were heavily involved).
Losers for the week were:
  • US Bonds, 
  • the US Dollar, 
  • WTI Crude Oil, 
  • Agriculture, 
  • China, 
  • Australia, and
  • Japan.

As well as October's end-of-month focus for fund managers, important upcoming dates are: 

  • the US Fed meeting (interest rate announcement and press conference) on November 2, and
  • the US midterm elections on November 8.

Until the midterm elections are over and all results are fully tabulated and settled, markets may continue to experience volatile, wild whipsaw intraday swings, until we see clear signs of capitulation...as I've discussed in many recent posts.

In this regard, keep an eye on:

  • the US Dollar,
  • the Energy sector, 
  • the Technology sector,
  • the Discretionary sector,
  • world Financial sectors, and 
  • major banks 
for signs of continued risk appetite (e.g., Technology, Discretionary and major banks), or flights to safety (e.g., US Dollar and Energy).


Tuesday, October 18, 2022

INSANE MARKET RISK: Who's Ready For Round Two? 😵

In answer to my question above, I'd say anyone who loves risk in BTC/USD, ARKK, and FNGU...and, even, NDX.

But, if you want to protect what cash you have left, beware of their extreme volatility (proclivity toward parabolic whipsaw swings) and weakness!

The following weekly VXN:NDX ratio chart depicts the wild volatility swings over the past five years. 

I don't believe that capitulation has been achieved in the NDX, yet..not until the ratio hits 0.0060, or even higher toward 0.0120.

In this regard, watch for a bullish Golden Cross to form on the weekly MAs, the RSI to remain above 50.00, and the bullish crossovers to hold on the MACD and PMO, to confirm this possibility.


Friday, October 14, 2022

SPX 2022: Buy Or Sell Or Stay Out?

* See UPDATES below...

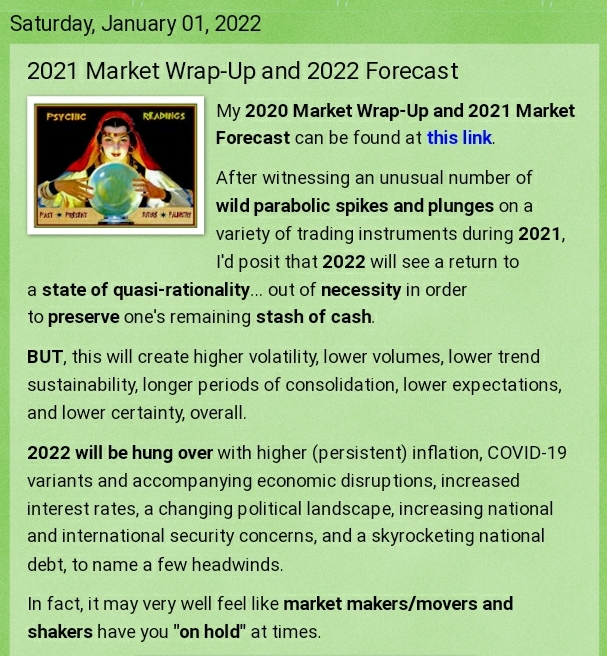
The following excerpts are taken from my 2021 Market Wrap-Up and 2022 Forecast (much of which has transpired, so far, this year).


Judging from the volatile rollercoaster action in markets this year, it seems that traders would have been better off, if they had:

  1. liquidated their equity positions,
  2. then just stayed with cash ($USD),
  3. then gone on vacation,
  4. then waited for capitulation before jumping back in, as I've described here, here, here and here,
  5. AFTER the Fed has stopped raising interest rates.

Instead, we've witnessed a dog's breakfast of volatility that will likely continue, due to the market's penchant for trading on "greed and fear" and "rumour and news" tactics.

SPX Monthly

SPX Daily

How markets closed the week (percentages gained/lost this week)...

US Major Indices: One-Week % Gained/Lost

US Major Sectors: One-Week % Gained/Lost

World Currencies: One-Week % Gained/Lost

And this roundup for the week from ZeroHedge...

* UPDATE Oct. 15...

It looks like markets have more downside in store over the coming weeks and months...plus a lot of volatility...


ZeroHedge excerpt


ZeroHedge excerpt

* UPDATE Oct. 19...

The following summary is taken from today's Beige Book report...the yellow highlights are mine.

The overall themes in the 12 Federal Reserve Districts are pessimismweakening demand, tight labour markets, and elevated prices.

Any way you look at things, if wages keep rising, this will contribute to higher inflation (in spite of potential lower prices) and lower returns for companies and their shareholders...and further volatility in the markets.

So, all in all, I'd say that today's report does not paint a rosy picture, for the foreseeable future.


Wednesday, October 12, 2022

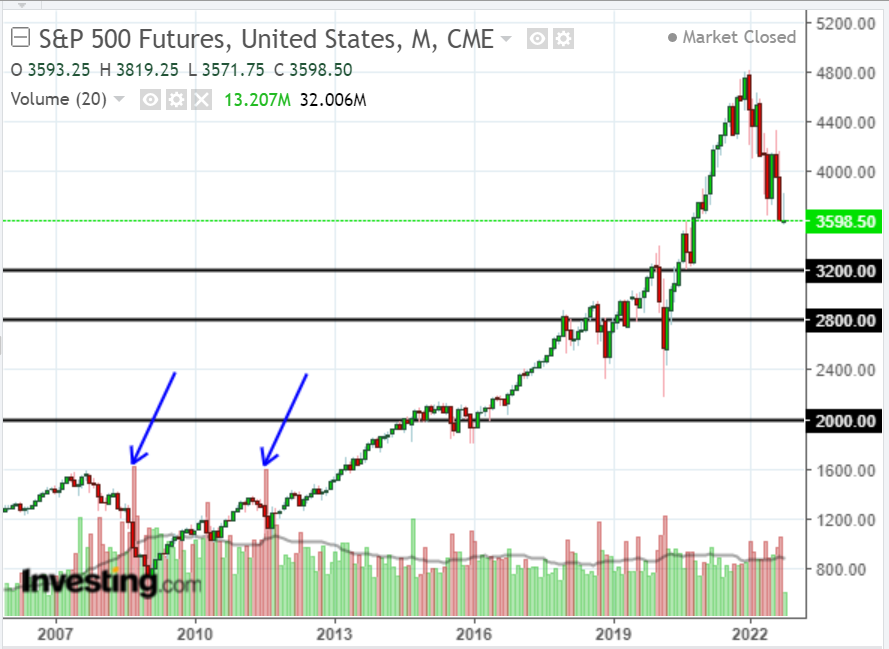
S&P 500 FUTURES INDEX: A Clue To Capitulation

When we see an extreme volume spike form on the following monthly chart of the S&P 500 Futures Index (ES), it may be close to a bottom/capitulation, particularly if it falls near one of the major support levels, as shown.

Further bottoming clues are described, in detail, in my articles of October 2, September 30, and September 24, pertaining to the corresponding SPX and the SPX:VIX Ratio.

Until then, I expect volatility to continue, producing large intraday swings in both directions.


Monday, October 03, 2022

CS & DB: Have You Ever Seen A More Perfect Union Of Banks On The Road To Zero?

* See UPDATES below...

The following monthly comparison chart illustrates the lock-step movements of Credit Suisse (CS) and Deutsche Bank (DB) since September 2001. 

Neither one recovered from the fall from their lifetime highs set in April 2007...right before the 2008/09 financial crisis.

They're both trading at or near their lifetime lows...just above zero.

No matter what pundits and bank executives say, and notwithstanding the fact that they were on the List of 29 Banks Deemed 'Too Big To Fail' by the G20 Financial Stability Board (published in November 2011), exactly how solvent are these banks, since charts don't lie?

Perhaps they funded one-too-many ESG company, or Bitcoin...the top 100 ESG companies are listed here.


The following monthly chart compares the Swiss Franc (CHF/USD) with the Euro (EUR/USD).

With some minor variations since October 1989, these currencies have traded in similar trajectories, as well. The Euro has experienced much more volatility and wild swings, while swings in the Franc have been tighter and more muted.

We'll see if the divergence of the lower monthly swing high set in the Euro in December 2020, versus the higher swing high of the Franc (leading to the sharp decline of the Euro below parity with the USD and to a lower swing low), will, eventually, drag the Swiss Franc below parity and a new swing low, as well.

Such a scenario [a CHF plunge to a new swing low (below its large sideways trading range) and hold below USD parity] could spell the downfall of Credit Suisse and, potentially, Deutsche Bank.

The following ZeroHedge article offers some insights relative to problems at Credit Suisse.


ZeroHedge excerpt

* UPDATE Oct. 5...

So, has CS bottomed? We'll see what happens. 

Either way, their chart is portraying severe weakness...presumably reflecting credit risk, which is not something that should be ignored in the face of an impending global recession.

* UPDATE Oct. 14...

So, this latest news is interesting...


ZeroHedge excerpt

ZeroHedge excerpt

Keep an eye on CHF/USD and on CS for developments.

At the moment, they are both down on the day, while CHF/USD is down on the month and CS is slightly off its October low.


BUT...no Fed panic...yet...

* UPDATE Nov. 23...

So far, the cash exodus from Credit Suisse in Q4 has been massive and historic...with no end in sight.


ZeroHedge excerpt

Its stock, CS, has plunged, once again, to 3.83 this morning, retesting September's low, with virtually no support below, except last month's record low of 3.70.