WELCOME

Welcome and thank you for visiting!

The charts, graphs and comments in my Trading Blog represent my technical analysis and observations of a variety of world markets...
* Major World Market Indices * Futures Markets * U.S. Sectors and ETFs * Commodities * U.S. Bonds * Forex

N.B.
* The content in my articles is time-sensitive. Each one shows the date and time (New York ET) that I publish them. By the time you read them, market conditions may be quite different than that which is described in my posts, and upon which my analyses are based at that time.
* My posts are also re-published by several other websites and I have no control as to when their editors do so, or for the accuracy in their editing and reproduction of my content.
* In answer to this often-asked question, please be advised that I do not post articles from other writers on my site.
* From time to time, I will add updated market information and charts to some of my articles, so it's worth checking back here occasionally for the latest analyses.

DISCLAIMER: All the information contained within my posts are my opinions only and none of it may be construed as financial or trading advice...please read my full Disclaimer at this link.

Dots

* If the dots don't connect, gather more dots until they do...or, just follow the $$$...

Beach Drinks

Beach Drinks

ECONOMIC EVENTS

UPCOMING (MAJOR) U.S. ECONOMIC EVENTS...

***2026***
* Wed. June 17 @ 2:00 pm ET - FOMC Rate Announcement + Forecasts and @ 2:30 pm ET - Fed Chair Press Conference

*** CLICK HERE for link to Economic Calendars for all upcoming events.

Showing posts with label EEM. Show all posts

Monday, October 24, 2022

Chaos In China's Hang Seng Index

* See UPDATE below...

In my post of March 14, I described a scenario where a drop and hold below 20,000 on China's Hang Seng Index (HK50) could see it plunge to 16,000, or lower.

It, subsequently, swirled around that level, finally closing below at the end of August, as shown on the following monthly chart.

It has since plummeted and closed on Monday at 15,180.69...losing 6.3% on the day.

Sellers are in control, as downside volatility is increasing.

Should price remain below 20,000, it could easily drop to 12,000, or even lower to 8,000.

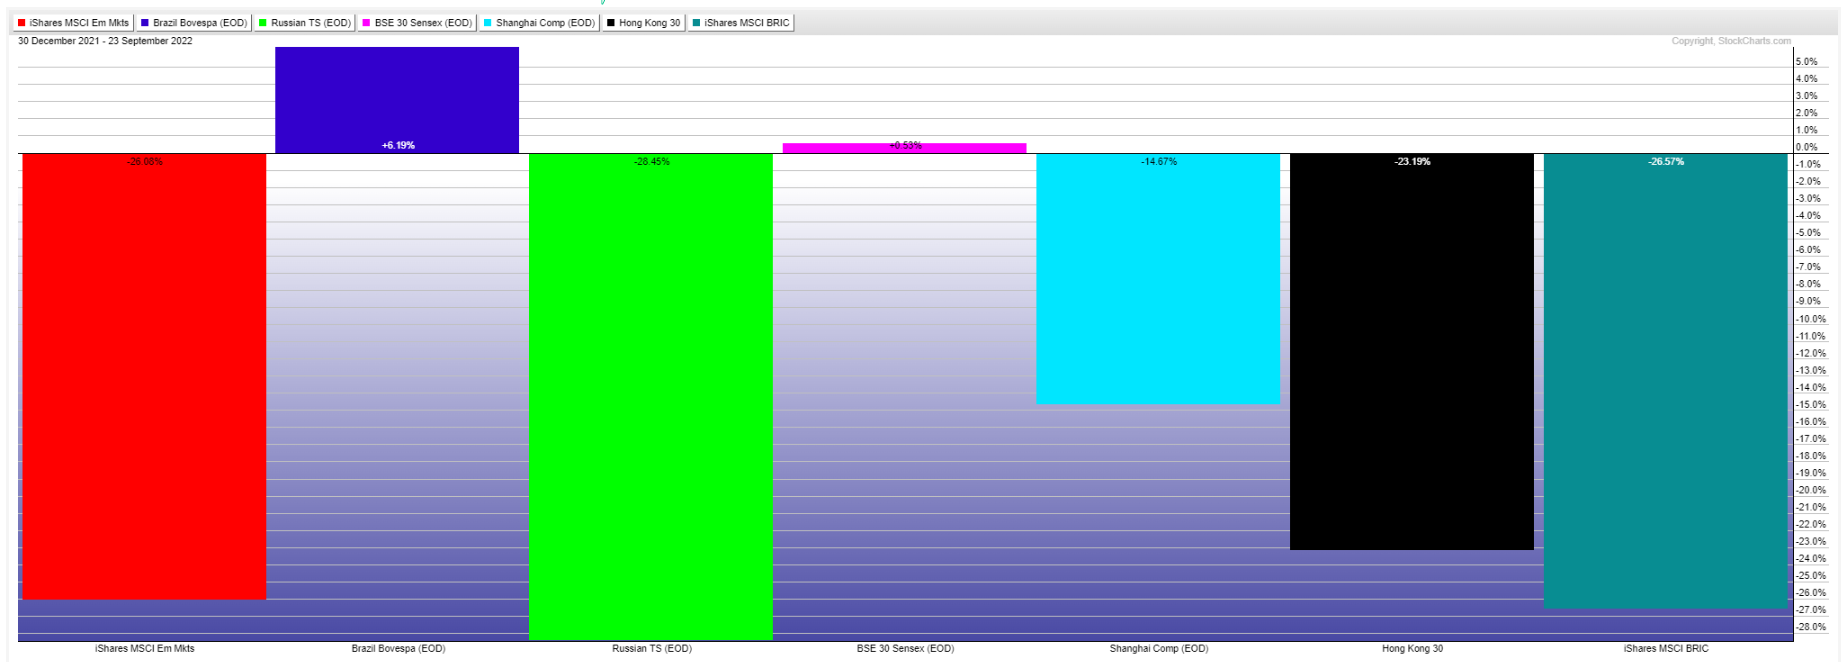
Monday was a bad day for all Chinese indices.

There are numerous major issues, with which China is grappling, including their property market, technology sector, zero COVID-19 policies, inflation, currency, support for Russia in their war with Ukraine, etc.,...none of which can be readily resolved...and none of which would be attractive to new foreign investment.

The following article describes some of those.

N.B. Further China weakness may drag other world markets (or their financial institutions) lower, if they are already heavily invested, directly or indirectly, in any of those markets. 

So, bear in mind the remarks I made in my post of October 22.

* UPDATE Oct. 29...

The Hang Seng Index lost further ground this past week...opening below 16,000 and closing at 14,863.06.

It closed below the bottom of a long-term uptrending channel the prior week around the 16,500 level, as shown on the following monthly chart.

Any sustainable rally over the coming weeks will need to see it retake and hold above, firstly, 16,000, then 16,500...for a possible retest of 20,000

Otherwise, it could easily plunge to 12,000, or, even, 8,000.

Correspondingly, the Shanghai Index (SSEC) is caught in a narrow band within a large matrix (between 3,000 and 2,840), as shown on the following monthly chart.

It's had difficulty remaining above 3,550 since January 2007, which is a formidable long-term resistance level (and part of a significant future apex within this matrix...forming roughly in April 2029).

Failure to convincingly retake and hold above 3,000, could see it plunge to 2,500, or, even, 2,000.

For now, China weakness continues.

* UPDATE Nov. 27...

From the following report, it's clear that the China boom of the 1990s, then the 2000s, has been badly damaged, as shown on the monthly chart of the Hang Seng Index (HK50) below.

HK50 has failed to continue with the upward trajectory and pace of those decades, evident by the break and plunge below the longterm rising channel this year.

Furthermore, HK50 has struggled to remain and gather strength above 20,000 for the past 16 years.

I find it hard to believe that China will regain its former glory any time soon, if ever, (a) for the reasons cited in the report, (b) for the aforementioned charting reasons, as well as, (c) the fact that world countries are moving away from their previous reliance on cheap Chinese goods in favour of domestic product development and production.

As such, I anticipate that HK50 will be locked in a large sideways trading range for some time -- complete with volatile whipsaw price action -- between 12,000 and 20,000.


Saturday, September 24, 2022

GLOBAL MONEY FLOW: Cash & Crash

I've written a number of posts in the last few months regarding the MSCI World Index and the SPX, several of which are here and here, respectively, (together with subsequent updates) warning of further market crashes.

The following Year-to-Date and One-Week Percentages Lost/Gained graphs clearly depict, at a glance, global money flow for 2022 and for the past week (graphs courtesy of StockCharts.com).


MONEY FLOW YEAR-TO-DATE


U.S. Major Indices

U.S. Major Sectors

European Major Indices

Canada, Japan & Australia Major Indices

Emerging Markets ETF, BRIC Major Indices & BRIC ETF

Commodity & Agriculture ETFs & Commodities

Currencies, BITCOIN, XLF, EUFN & GXC

MONEY FLOW SEPT. 19-23


U.S. Major Indices

U.S. Major Sectors

European Major Indices

Canada, Japan & Australia Major Indices

Emerging Markets ETF, BRIC Major Indices & BRIC ETF

Commodity & Agriculture ETFs & Commodities

Currencies, Bitcoin, XLF, EUFN & GXC

SUMMARY

Overall, the biggest winners have been:

  • the Oil and Gasoline sectors, 
  • as well as the U.S. Dollar.

The biggest losers have been:

  • Bitcoin, 
  • global equities (especially U.S., China, Russia, Europe and the emerging markets ETF, EEM), 
  • global Financial ETFs (U.S., Europe & China), 
  • foreign currencies, 
  • U.S. Bonds, 
  • copper & precious metals, and
  • U.S. Discretionary, Technology, Materials and Financial Sectors.

During the past week, there has been:

  • continued buying of the U.S. Dollar, 
  • continued selling of Bitcoin, 
  • some selling in Oil and Gasoline,
  • accelerated selling of the British Pound, the Euro, Aussie Dollar and Canadian Dollar,
  • accelerated selling of the U.S., European and Chinese Financial ETFs (XLF, EUFN and GXC), and
  • accelerated selling of global Major Indices (including U.S.), and U.S. Major Sectors.


CONCLUSIONS

All in all, I see no pivot away from U.S. Dollar strength and global equity and sector (and Bitcoin) weakness...YET.

So, for the moment, U.S. cash is king, as the U.S. Fed has signalled its intent to continue raising interest rates and keep them elevated for some time after inflation has declined to the Fed's 2% maximum inflation target...which could last well into 2025.

*********

P.S. After I published this post, I came across the following article...which, interestingly, confirms my conclusions...

And, more analysts' opinions...


Friday, September 16, 2022

FedEx Volatility: Three Strikes And You're Out!

* See UPDATE below...

Following Thursday's after-hours dire world-wide recession warning by FedEx CEO, its stock (FDX) has plunged this morning.

FDX has a history of volatile parabolic spikes and plunges. In fact, it had difficulty, twice, in holding any gains above 120.00 since it broke above in September 2013, as shown on the following monthly chart. Price is heading back to that level for a third time, as I write this post.

A drop and hold below 120.00 could see it hit its next major support level of 80.00, or lower.

If this is a harbinger of things to come, it will confirm that world markets are in for a very rough ride (as I first reported on July 26 and later updates).


ZeroHedge excerpt


ZeroHedge excerpt

* UPDATE Sept. 19...

It seems to me that markets have 'levitated on myths' since Day One, especially since March 2009, in the weeks, months and years following the 2008/09 financial crisis.

Fed Chairman Powell can't fix the global supply chain crisis, so his rate-raising actions won't curb inflation entirely, but will contribute to the giant economic mess that countries around the world now find themselves trying to overcome.

People, especially those on fixed and low incomes (and even middle incomes), are in for a lot of pain...thanks to the artificial market and economic environment that global central bankers have created over many years.

In other words, visualize the proportionality of 'cause and effect' and you get the picture.

Cause...Effect?


ZeroHedge excerpt

ZeroHedge excerpt

Abraham Maslow (Maslow's Hierarchy of Needs) would be rolling in his grave if he saw the state of things now. 

Most people (99%) around the world are still struggling in the bottom two levels of the Hierarchy.

So much for so-called 'personal progress' over the centuries! 🤔

Maslow's Hierarchy of Needs


Sunday, August 28, 2022

Will The PHO ETF Sink Or Swim?

The following monthly chart of the Invesco Water Resources ETF (PHO) shows that price has been under stress since January 2022.

This followed a lengthy and unprecedented amount of bullish momentum and rate-of-change activity in the months from November 2020 until this year.

It pushed the price up from a low of 41.21 to a high of 61.07 before dropping to a low of 43.22 by this past June...nearly wiping out all of its gains since then.

If global water resources remain under pressure and continue to dry up, as described in the Zero Hedge article below, we may see PHO retest the 40.00 level, or drop lower.

Keep an eye on a potential increase of bearish momentum and rate-of-change to arise on this timeframe for clues of further weakness ahead for PHO.

Alternatively, look for the reverse scenario occurring to signal a possible retest of the prior monthly swing high, or push higher.


Thursday, July 28, 2022

Part II : Joe Biden's Presidential Survival


N.B. This post is a continuation of my lengthy article, "How Long Can President Biden Survive in 'Survival Mode?'" (Part I), which provides extensive background information, data and links to public articles.

~~~~~~~~~

* See UPDATE below...

The MSCI World Index has been in freefall since January, as shown on the following monthly chart.

Major support sits at 2000, while longer-term supports lies at 1600.

Threats of world-wide recession are looming, as described in the following article...


ZeroHedge excerpt

The following posts provide further details and warnings in this regard:

Trade with caution!

The U.S. is now in a technical recession...but the hucksters  (including President Biden) would have you believe that technical data doesn't matter and that everything is rosy...


The following sums up the current chaotic state of affairs...choose your definition and place your bets accordingly, if you dare. 😏

ZeroHedge excerpt

* UPDATE July 29...

Nice to know that America is not experiencing famine...White House gobbledegook blatant lies have gotten even more bizarre! 😕

Joe Biden and his cronies are completely tone-deaf and just don't care about Americans

Consumers are experiencing stress, not confidence, in Biden's economy...

Oh, look...more examples of Democrat hypocrisy...👀

More scandals surface in Joe's FBI...targeting Americans, including parents of school children.

Reminder of Joe's soft-on-China policies...why, if his own FBI has testified before Congress, warning that China is America's biggest threat?

Time's running out for Joe to right the entire mess that he created.

* UPDATE Aug. 1...

Of course the U.S. is in a recession (or a "banana" as was sarcastically called during former President Jimmy Carter's recession, because he forbade the usage of that term).

If you put lipstick on a pig, it's still a pig. 😏


ZeroHedge excerpt

* UPDATE Aug. 5...