The following graphs depict percentages gained/lost world-wide for the third week of October for a variety of major world indices, sectors, commodities, currencies and banks.

US Major Indices

US Major Sectors

European Major Indices

Canada, Japan & Australia
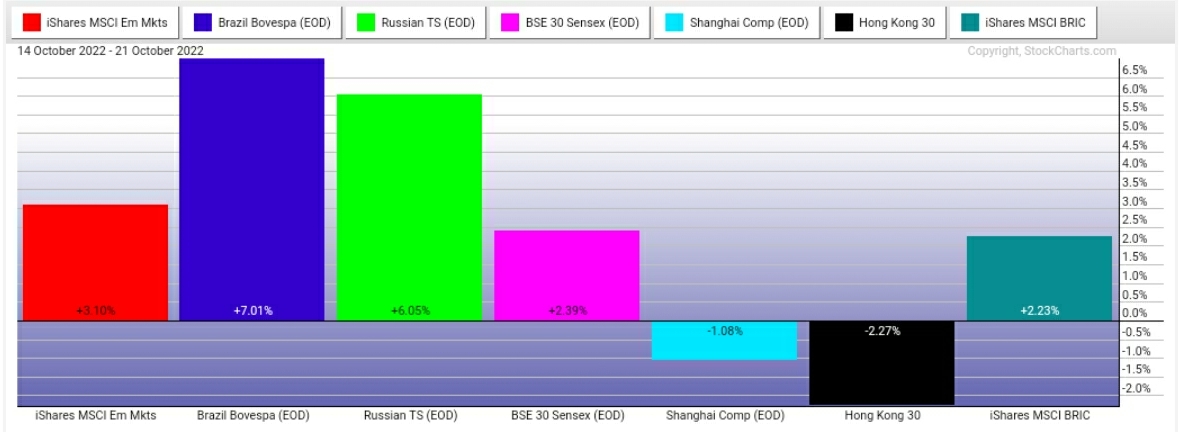
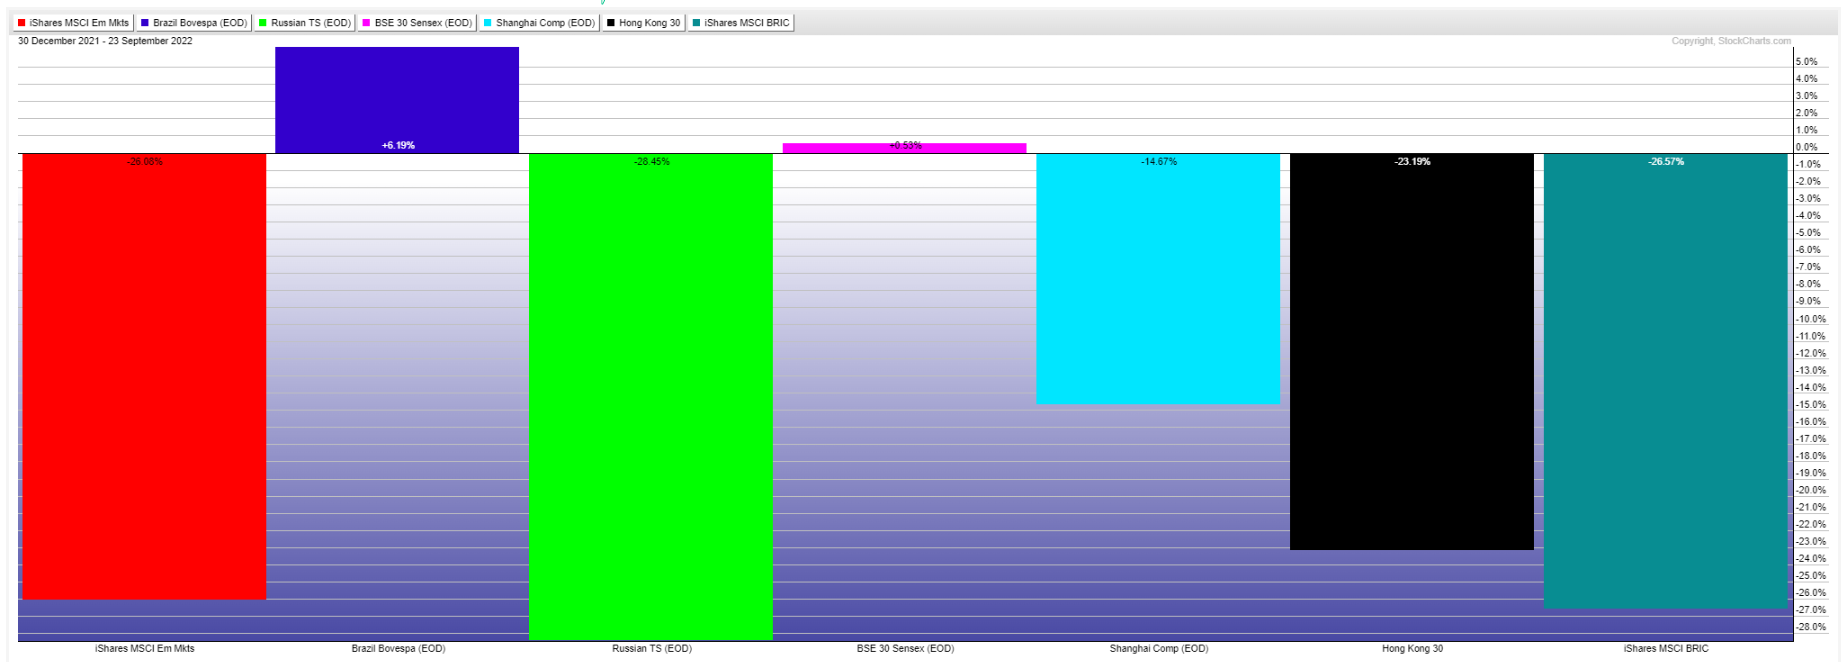
EEM & BRICs

Agriculture & Commodities

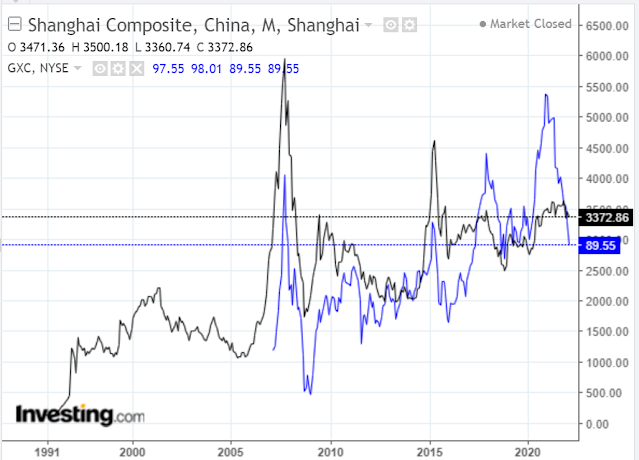
Currencies, US Bonds, Bitcoin, XLF, EUFN & GXC

Major Banks
At a glance, traders favoured:
- high-risk versus low-risk assets (growth over value),
- US markets versus Europe and Canada,
- the Energy sector, particularly Brent Crude Oil,
- Brazil and Russia,
- Gasoline,
- Silver, Platinum and Copper,
- the Aussie and Canadian Dollars, and, to a lesser extent, the Euro and British Pound Sterling,
- US and European Financial ETFs, and
- major banks (perhaps bank buy-backs were heavily involved).
- US Bonds,
- the US Dollar,
- WTI Crude Oil,
- Agriculture,
- China,
- Australia, and
- Japan.
As well as October's end-of-month focus for fund managers, important upcoming dates are:
- the US Fed meeting (interest rate announcement and press conference) on November 2, and
- the US midterm elections on November 8.
Until the midterm elections are over and all results are fully tabulated and settled, markets may continue to experience volatile, wild whipsaw intraday swings, until we see clear signs of capitulation...as I've discussed in many recent posts.
In this regard, keep an eye on:
- the US Dollar,
- the Energy sector,
- the Technology sector,
- the Discretionary sector,
- world Financial sectors, and
- major banks