WELCOME

Welcome and thank you for visiting!

The charts, graphs and comments in my Trading Blog represent my technical analysis and observations of a variety of world markets...
* Major World Market Indices * Futures Markets * U.S. Sectors and ETFs * Commodities * U.S. Bonds * Forex

N.B.
* The content in my articles is time-sensitive. Each one shows the date and time (New York ET) that I publish them. By the time you read them, market conditions may be quite different than that which is described in my posts, and upon which my analyses are based at that time.
* My posts are also re-published by several other websites and I have no control as to when their editors do so, or for the accuracy in their editing and reproduction of my content.
* In answer to this often-asked question, please be advised that I do not post articles from other writers on my site.
* From time to time, I will add updated market information and charts to some of my articles, so it's worth checking back here occasionally for the latest analyses.

DISCLAIMER: All the information contained within my posts are my opinions only and none of it may be construed as financial or trading advice...please read my full Disclaimer at this link.

Dots

* If the dots don't connect, gather more dots until they do...or, just follow the $$$...

Beach Drinks

Beach Drinks

ECONOMIC EVENTS

UPCOMING (MAJOR) U.S. ECONOMIC EVENTS...

***2026***
* Wed. June 17 @ 2:00 pm ET - FOMC Rate Announcement + Forecasts and @ 2:30 pm ET - Fed Chair Press Conference

*** CLICK HERE for link to Economic Calendars for all upcoming events.

Showing posts with label Dow Life-Time High. Show all posts

Monday, February 28, 2022

Is There A Dow Rule-Breaker Lurking on February 28? 😏

* See UPDATES below...

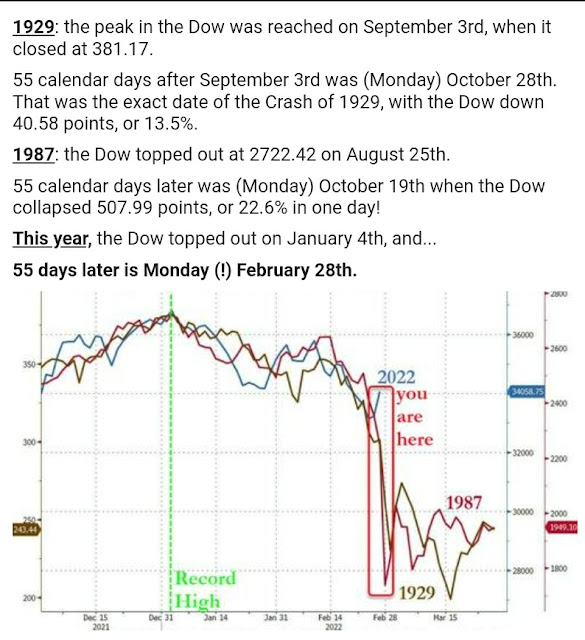
IF there is an "old" Dow rule-breaker lurking about somewhere in the ether, then Monday's trading should not end in a "Crash." 

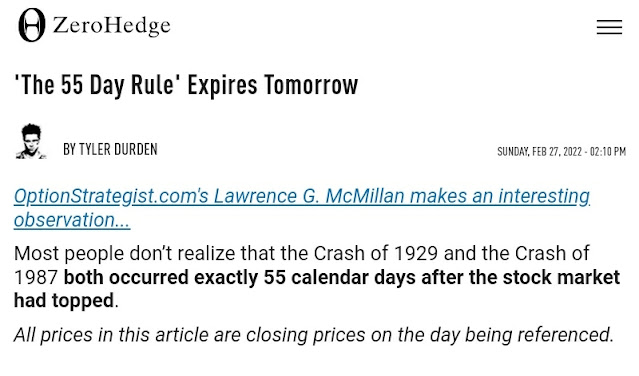
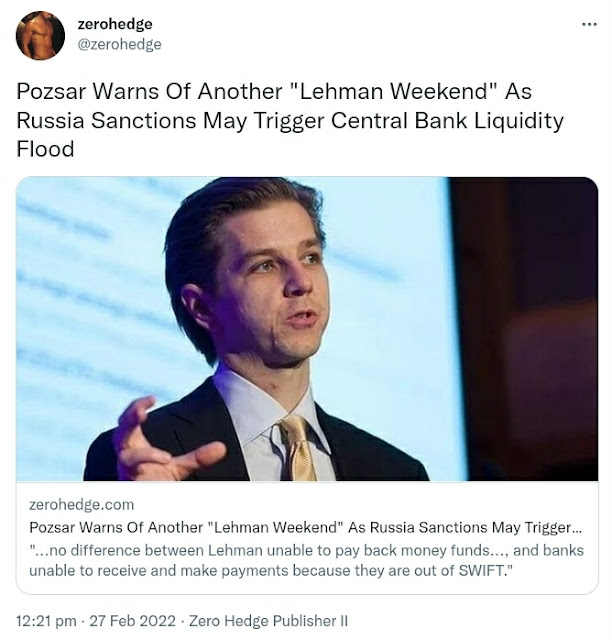
OTHERWISE...brace yourselves if history repeats itself, as described in the following ZeroHedge article.

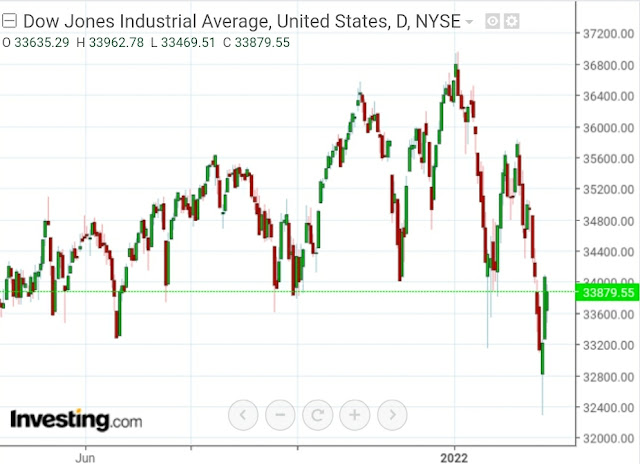
BUT...although the Dow 30 Index closed at its all-time high on January 4, it reached an intraday all-time high on January 5...so, 55 calendar days later could put the "Crash" date forward by one day to March 1.

SO...either way, we may (or may not) see a "Crash" on Monday or Tuesday...depending on whether the "old" rule-breaker shows up. 😏

* UPDATE February 28...

No "Crash" today...

* UPDATE March 1...

No "Crash" today, either...the "Old Guy" (Fed Chairman Powell???) is still around, for now...we'll see how long that lasts.

P.S. By the way, Chair Powell looked nervous and stressed as he testified before the House Financial Services Committee on March 2
His responses to various questions posed by Committee members pertining to rampant and rising inflation, as well as the oil and gas industry relative to Biden's climate change policies/agenda, sounded weak, wishy-wasy and ill-prepared. 
It didn't sound like the Fed is prepared to act in any meaningful or serious way to quickly tamp down inflation and its destructive consequences. It appears that they are more concerned with keeping markets over-inflated at record levels than they are at deploying their monetary policies in a sound manner, as their mandate so requires (lacking or ignoring serious predictive warnings)...if they were, I doubt that inflation would have reached current levels.

So, I may not be wrong in assuming that the "Old  Guy" who showed up in markets yesterday (and today) may, in fact, be Powell...or, rather his "silent influence."


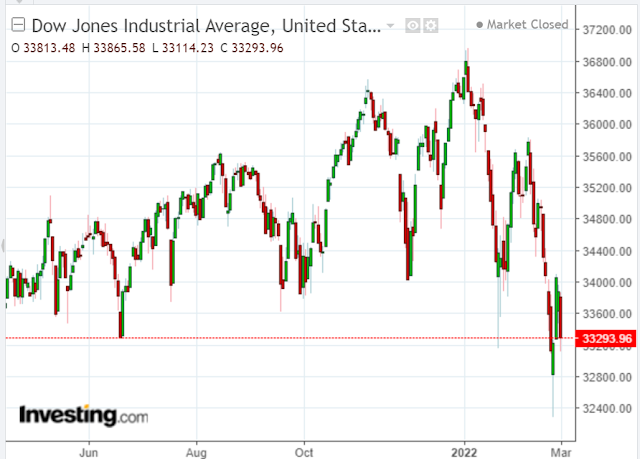
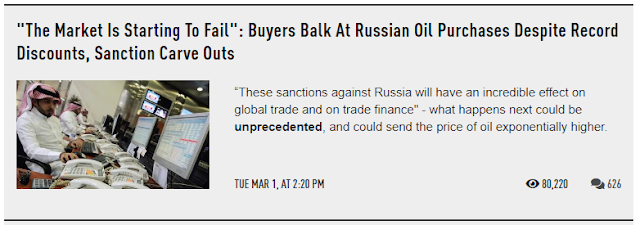
MEANWHILE...U.S. equity markets are clinging to and threatening to break below major support...so, stay tuned as things heat up in global Oil markets...and other areas of concern in which the Fed may be ill-prepared to act in a timely, effective and prudent manner.


Monday, June 21, 2021

Biden's 'PPT' Activated?

Has President Biden's 'Plunge Protection Team' been summoned to the White House to activate measures to combat the threat of market weakness...which arose in equity markets modestly last week, as shown on the following weekly chart of the Dow 30?


In the grand scheme of things, this drop is a mere blip, as shown on the monthly chart below.

If true, it's too bad that Biden doesn't spend his time to micro-manage the southern border crisis that he created, instead...and allow the 'free' markets to carry on freely, without political interference.

Tuesday, November 24, 2020

'Trumpenomics' Shatters Glass Ceiling: Dow 30 Hits 30,000

The success of President Trump's First-Term economic policies and programs, including Operation Warp Speed, were reflected in US markets today. The Dow 30 Index smashed through 30,000, setting an all-time record high! 

The Balance of Power lies with buyers...in fact, it also hit a record high today. 

With no overhead resistance, buyers are free to continue this bull run.


Tuesday, January 23, 2018

SPX 3000?

Year-to-date gains/losses made in the 9 Major Indices and 9 Major Sectors  are shown on the graphs below...amazing gains after only 15 trading days.

The SPX is already over half-way to the 10% target I had forecast in this post for the entirety of 2018.


An extended outlook for the SPX sees major resistance at 3000 (its next "Big Round Number"), which is confluent with two external Fibonacci retracement levels (2984 and 3047), as shown on the monthly chart below.

When would it hit that level? It's anyone's guess, as anything seems possible in the current buoyant market environment. The momentum indicator is still rising on this long-term timeframe and is making new all-time highs in the process. Another 5% gain would send it up to that price, so we could be looking at a year-end target date to bring total gains of 11% by then...not an unreasonable expectation.

Another scenario is that it could reach that level around August of this year (pinpointed at the pink arrow shown on the second monthly chart below), which would put it at the +4 standard deviation level of a very long-term upward-sloping regression channel (beginning from the March 2009 low). That would give it plenty of "wiggle room" to allow for some price dips in between now and then. At the moment, price is in between the +3 and +4 standard deviation levels.

Alternatively, we may see a hit of 3000 (or beyond to its next major external Fibonacci level of 3047) at the +5 channel deviation level sometime in February, potentially taking the Dow 30 along with it to around 26,700 (as I described recently in this post). Subsequently, these indices may move sideways for awhile to allow some of this parabolic surge (that began after the November 2016 Presidential election) to dissipate.

Other factors to monitor, in this regard, are outlined in my above-referenced market forecast post.


Monday, January 22, 2018

Congress Stages an OPEN/CLOSED "Revolution"

It's a good thing that OPEN/CLOSED signs are double-sided and can be easily flipped.

After a 3-day government shutdown, the Senate and House passed a temporary 3-week Continuing Resolution to continue funding the government through February 8th...it's now on its way to President Trump to sign (N.B. signed later today).

So, the OPEN sign is displayed, once again, but like a revolving door, the CLOSED sign will magically re-appear if the 2018 Budget is not passed by February 9th.

Caution...more political theatrics to come! 👀


Here's how the Major Indices closed today (shaking off the political sparks)...all at record-breaking all-time NEW highs and closing highs.


Friday, January 19, 2018

U.S. Government Shutdown Looms...$7.8 Trillion at Stake

* See UPDATES below...

As Democrats threaten to shut down the government at midnight tonight (Friday) without passing the 2018 budget, $7.8 Trillion hangs in the balance (gains made since the 2016 Presidential election).

The following monthly charts show prices of the Dow 30, S&P 500, and Nasdaq Composite Indices as at 12:15 pm ET today, with the blue horizontal line marking election-day prices.

A lot of investments (including pension funds and 401K accounts) in the U.S. stock markets are at stake...stay tuned for what market chaos may await next Monday.

If only my ancient crystal ball had come with automatic upgrades...👀


Source: ZeroHedge.com


* UPDATE @ market close...

Tuesday, January 16, 2018

Dow 30 Index Hits 26,000 as U.S. Stocks Gain $7.8 Trillion in Value Since 2016 Election

* See UPDATES below...

TODAY'S NEW ALL-TIME HIGHS:
  • the Dow 30 Index spiked above 26,000 briefly today (Tuesday), as shown on the following Monthly chart
  • the S&P 500 Index spiked briefly above 2800, as shown on the following Monthly chart
  • the Nasdaq Composite Index spiked briefly above 7300, as shown on the following Monthly chart
  • ...amid reports that measurements of the Wilshire 5000 Index indicate that U.S. stocks gained roughly $7.8 Trillion in value since the November 8, 2016 Presidential election, as shown on the Daily chart below.

As I mentioned in my post of January 11 regarding the Dow, major support sits at 25,125 and major resistance lies at 26,702 (two external Fibonacci retracement levels)...anything can happen in between in the coming weeks.


As an aside, the President is in "excellent health," as reported in a lengthy and detailed White House press briefing today by his Physician, following a complete physical exam last week by Dr. Jackson and a team of 12 specialists, which should reassure markets...if anyone was previously concerned (other than some media pundits and "arm-chair psychiatrists" who have repeatedly questioned his fitness, ad nauseam...it's time to report the "real" news, folks, not imaginary news based on pure speculation and hypotheticals...Americans deserve honest, unbiased news, based on facts).


Watch the full White House Press Briefing (including Dr. Jackson's report and interview)...


And, a bit of humour thrown into the mix...


* UPDATE January 17 @ 12:55 pm ET...

Thursday, January 11, 2018

Where's the Resistance on the Dow 30 Index?

* See UPDATE below...

Since the December 8, 2016 U.S. Presidential election, the Dow 30 Index has gained around 42.57%, as of 2:00 pm ET today (Thursday). It also crossed above a new all-time high of 25,500, as shown on the two Daily charts below.


The following Monthly chart shows that price is trading in between support (25,125) and resistance (26,702), namely two external Fibonacci retracement levels.

Of course, anything can happen in between these levels, but they may play an important role in the days/weeks ahead...ones to watch, especially 25,125.


P.S. The Dow made further gains this afternoon and closed up 205 points at 25,574, bringing gains since the election to 42.97%, as shown on the Monthly and Daily charts below.


* UPDATE January 12...

And, to close out the week, the Dow just kept on spiking ever higher, to close at a new high of 25,801.95...bringing its gains since the election to 44.24%.


Thursday, January 04, 2018

Dow Hits Another New Milestone...25,000

Further to yesterday's post, the Dow 30 Index hit 25,000 today, as the S&P 500 and Nasdaq Composite Indices extended their rally above their Big Round Numbers, as shown on the following Daily charts.

We'll see if this breakout above December's consolidation zone lasts.


Meanwhile, volatility remains near record-level lows, as shown on the following Monthly chart of the VIX...


...and this year's breakout outpaces volatility, as shown on the following Daily ratio chart of SPX:VIX.