WELCOME

Welcome and thank you for visiting!

The charts, graphs and comments in my Trading Blog represent my technical analysis and observations of a variety of world markets...
* Major World Market Indices * Futures Markets * U.S. Sectors and ETFs * Commodities * U.S. Bonds * Forex

N.B.
* The content in my articles is time-sensitive. Each one shows the date and time (New York ET) that I publish them. By the time you read them, market conditions may be quite different than that which is described in my posts, and upon which my analyses are based at that time.
* My posts are also re-published by several other websites and I have no control as to when their editors do so, or for the accuracy in their editing and reproduction of my content.
* In answer to this often-asked question, please be advised that I do not post articles from other writers on my site.
* From time to time, I will add updated market information and charts to some of my articles, so it's worth checking back here occasionally for the latest analyses.

DISCLAIMER: All the information contained within my posts are my opinions only and none of it may be construed as financial or trading advice...please read my full Disclaimer at this link.

Dots

* If the dots don't connect, gather more dots until they do...or, just follow the $$$...

Beach Drinks

Beach Drinks

ECONOMIC EVENTS

UPCOMING (MAJOR) U.S. ECONOMIC EVENTS...

***2026***
* Wed. June 17 @ 2:00 pm ET - FOMC Rate Announcement + Forecasts and @ 2:30 pm ET - Fed Chair Press Conference

*** CLICK HERE for link to Economic Calendars for all upcoming events.

Friday, February 25, 2022

Firday's Flubs 😕

So who's lying? 

This ridiculous claim was made by White House Press Secretary Jen Psaki, after President Biden emphatically said in yesterday's press conference that the sanctions imposed against Russia were NEVER about deterring President Putin from invading Ukraine.

However, VP Kamala Harris, Secretary of State Antony Blinken, and National Security Advisor Jake Sullivan are all on the record recently, insisting that sanctions WERE meant to act as a deterrence.

Someone forgot to tell Joe Biden the storyline. 😕

This isn't the first time that Psaki and others in his administration (and cabinet) completely contradicted something that Biden has said since January 2021...and I doubt it will be the last.

What a joke! Who are Americans and the rest of the world supposed to trust anymore and what are they supposed to believe?

Perhaps the President and his administration will finally be held to account for all their blunders, flip-flops, and lies, leading to a variety of national security crises, when the GOP retakes the House and the Senate in the November mid-term elections.


Thursday, February 24, 2022

WTI CRUDE OIL: Little Price Resistance Above 100.00...Retest Of 147.27 Is Possible

I last wrote about WTI Crude Oil in my post of September 12, 2021.

I identified price targets of 80.00 and 100.00, provided it broke and held above 70.00.

Following Russia's declaration of war and invasion last night of UkraineOil hit 100.54 today, before falling back to close at 94.75...which is around a convergence point (lower red arrow) of a 40% Fibonacci Extension level with a 125% External Quadrant level, and is just above the bottom 1/4 of a long-term rising channel, as shown on the following monthly chart.

There is little price resistance above 100.00, as shown on the pink TPO Profile along the right-hand side of the chart.

Price targets are identified by the other three red arrows, which are also convergence points on the Fibonacci Extension with the External Quadrant. The highest red arrow also happens to converge with the upper 1/4 of the rising channel.

If price can remain above 90.00, it has a good chance of continuing its rally to these three targets, namely, 100.00, then 111.00-112.00, and then, ultimately, retesting its prior all-time high of 147.27.

Otherwise, a drop and hold below 90.00 could see a retest of 80.00, then 70.00, or lower.

At the moment, the "path of least resistance" is up.


Monday, February 21, 2022

S&P 500 Futures Index Approaching Bearish Head & Shoulders Neckline

* See UPDATE below...

My post of January 31 contained Pivot Point support and resistance levels/targets for February for the S&P 500 Index (SPX).

The following weekly chart of the S&P 500 Futures Index (ES) shows that price is in the midst of forming a bearish Head and Shoulders pattern.

The sloping neckline on this formation sits around 4200, which is just below February's SPX S1 support level.

Should price break below that level, the next levels of support are around 3900 and 3600, respectively...just below SPX S2 and S3.

The Balance of Power is still held by the sellers...and will continue if price breaks and holds below 4200.

If not, price will continue its volatile, directionless whipsaw swings in both directions within this typical topping pattern.

* UPDATE February 23 (11:00 pm ET)...

WAR: Russian President Vladimir Putin has declared war on and attacked Ukraine.

Fox News Pentagon correspondent Jennifer Griffin just reported that,"It's the beginning of a very serious full-scale military invasion of Ukraine, according to a senior U.S. administration official."

Markets around the world are plunging.

Follow ZeroHedge on Twitter @zerohedge for live commentary.

As at 11:00 pm ET, the S&P 500 Futures Index (ES) has sliced through the Head & Shoulders neckline at 4200 and is trading well below, as shown on the following weekly chart.

The next major support level lies at 3900.

SO, NOW WHAT?

President Biden needs to immediately reverse his ban on the Keystone XL pipeline project from Canada and reverse restrictions on oil and gas drilling in the U.S., in order to unleash increased production and bring down spiking oil, gas and gasoline prices that triggered, and are contributing to, the inflation spike.

Inflation is out of control and stagflation is biting its heels...threatening national security! 

This is not a problem that can be solely rectified by the Federal Reserve

Biden's administration owns this and it is incumbent on President Biden to restore economic and national security stability to the United States...without further delay.

Wake up, America!

~~~~~~~

NOTHING
FALLS INTO
THE MOUTH
OF A
SLEEPING LION.
- Wise words with love from your ancestors.

~~~~~~~


Saturday, February 12, 2022

Ironic, eh? 😕

* UPDATE February 13...

From the interim Conservative party leader, Candice Bergen...

We'll see what happens tomorrow...

* UPDATE February 14...

The motion was blocked.

Instead, Prime Minister Trudeau invoked the Emergencies Act...which has never been used before in Canadian history...which prompted this reaction from the Canadian Civil Liberties Association...


...as well as reactions from others, including a national security expert at Carleton University in Ottawa...and constitutional law scholar, Professor Jonathan Turley...

...and, this objection from Alberta Premier Jason Kenney...


Wednesday, February 09, 2022

A Picture Is Worth 30 Trillion Words

* See UPDATES below...

The U.S. National Debt has now exceeded $30 Trillion, as shown below.

The following video is a visual presentation of this amount...

Who will pay this off?...how?...when?...especially when inflation is running rampant in Joe Biden's America...

* UPDATE February 10...

Here's your proof of out-of-control inflation...now at 7.5% and running hotter each month with no end in sight, and the Federal Reserve still hasn't raised interest rates!

* UPDATE February 15...

Producer prices skyrocketed in one month, as shown below...also, at 9.7% YoY.

Inflation is not abating any time soon, but has been firmly entrenched (and has exceeded monthly expectations) for over a year now.


* UPDATE February 16...

This stunning headline caught my eye...


Tuesday, February 08, 2022

Facebook Fizzles

Facebook (FB) has had half a Trillion dollars scalped from its value recently, as noted in the following article.

CEO Mark Zuckberg, himself, has been a seller, not a buyer, for several years, as shown here.

FB is approaching its 'Chaos Zone,' which begins around the 200 level, as shown on the following monthly chart.

A drop and hold below that level could send it plunging to 120, or lower in short order.

Or, we may see it whipsaw within that zone for some time before this stock and its social media platform, either recover, or fizzle into obsolescence.

At the moment, the sellers are firmly in control on this timeframe...favouring the fizzle scenario.


Monday, February 07, 2022

China's Shanghai Index: Failure To Hold Its Launches

China's Shanghai Index (SSEC) is trading below major resistance around 3500 to 3600, as shown on the following monthly chart.

Past price spikes above that level have been relatively short-lived.

Any attempts to launch a third price spike may also fizzle. At the moment, the RSI is falling and is not signalling an imminent breakout on this timeframe.

Failure of price to break through and hold above 3600, then 4000, may see it retest 3000, or, even, 2000.

Either way, there is a lot of 'wiggle room' for erratic price spikes to occur in both directions on the SSEC over the coming months.


Alibaba Ensconced In Chaos Zone

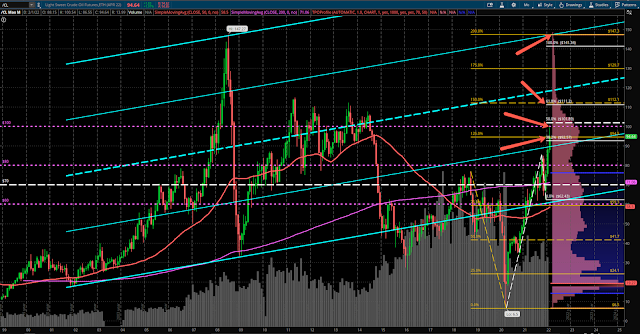
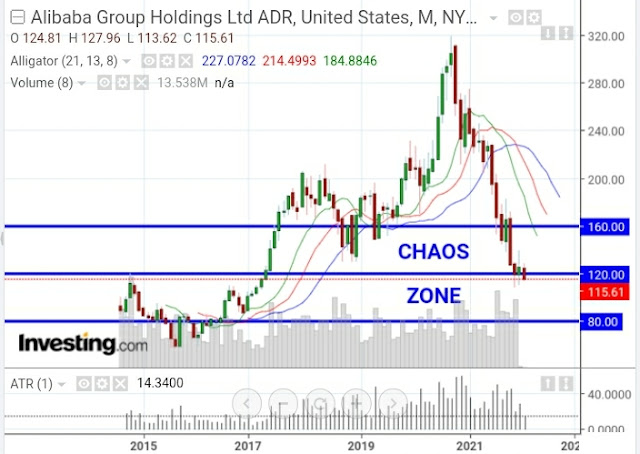
Alibaba (BABA) has plunged into what I call a 'Chaos Zone,' as shown on the following monthly chart.

As you can see, it's nearing its IPO price of 92.70 in September 2014, after reaching a high of 319.32 in October 2020.

The following article mentions a scenario that may occur.

Before we see that happen, if at all, we may see BABA drop somewhat further on this rumour, then reverse sharply and possibly retest the 160.00 level, or thereabouts. I'd look for a large volume spike, together with an extreme ATR print (based on a value of one period, as shown), to confirm such a V-bottom reversal had occurred at a lower price level.

It may be that, during such a reversal to the upside, SoftBank begins to dump its shares, in which case, we'd likely see volatile price moves in both directions...possibly within the upper half of the 'Chaos Zone,' or around the 120.00 level. Price may spin around 120.00 ('thread the needle') before it moves erratically higher toward 160.00.

Failure of BABA to move and hold above 160.00, on increasing volumes, may signal much further weakness ahead, with price, ultimately, retesting 80.00, or lower.

So, there is a lot of room for wild price swings to occur within BABA's 'Chaos Zone,' along with the release of wild rumours about SoftBank, or something/someone else.

Buyer beware!

P.S. SoftBank's own stock (SFTBY) has dropped considerably from its 2021 high of 50.00 and is mired in its own 'Chaos Zone,' as shown on the following daily chart.

It's in solid downtrend and is still under the bearish influences of a moving average Death Cross that formed in mid-2021.

A drop and hold below 20.00 could force a retest at 17.5, or lower at 15.00

A drop and hold below 15.00 could prompt its sale of some or most/all of its stake in BABA, as described above...or, even as soon as a break and hold below 20.00 on increasing volumes.

The monthly chart of SFTBY shows a macro view of price action, the 'Chaos Zone,' and other major support and resistance levels.

Watch for any extreme spikes in the volume and the ATR indicator (shown with an input value of one period) to, potentially, verify a trend reversal after any further plunge lower in price on this timeframe...particularly if it breaks and holds below 20.00 with force.

The following daily ratio chart of SFTBY:BABA shows that there has been a whipsaw struggle for relative strength between the two since mid-2018.

This ratio has been trading in its own 'Chaos Zone' since the beginning of 2021.

A rapid plunge on this ratio could spell big trouble for both stocks. A drop and hold below 0.150 could be catastrophic for both, so keep an eye on this.

In any event, they're both weak and mired in their own 'Chaos Zones.'

Expect volatile churn to continue until we see clear breakouts or breakdowns and holds, with conviction...on BABA, SFTBY, and SFTBY:BABA.


Friday, February 04, 2022

US 10-Year Treasury Yields: 3.0% Target

Further to my post of December 21, 2021, the US10YT has sliced through the neckline of a Reverse Head and Shoulders formation, as shown on the following monthly chart...a bullish move.

Not much resistance lies overhead until around the 3.0% level.

The Balance of Power lies with buyers, as does momentum, depicted on the Awesome Oscillator

A drop and hold below major support at 1.6% may signal further weakness ahead. 

Keep an eye on the above two indicators for clues on possible direction for this longer-term timeframe.


Thursday, February 03, 2022

President Biden's Failure In Leadership: Afghanistan

I've written extensively on President Biden's disastrous, chaotic and deadly withdrawal of American troops from Afghanistan

The link to my report is here.

A bombshell report has been written regarding leaked White House documents, which describe just how poorly the whole military exercise was planned and carried out. 

The following article provides details.


GOP excerpt

* UPDATE February 8...

And...it gets worse as another damning report is released...


Fox News excerpt

~~~~~~~~~

Why is Joe Biden still President/Commander-in-Chief of the United States?