WELCOME

Welcome and thank you for visiting!

The charts, graphs and comments in my Trading Blog represent my technical analysis and observations of a variety of world markets...
* Major World Market Indices * Futures Markets * U.S. Sectors and ETFs * Commodities * U.S. Bonds * Forex

N.B.
* The content in my articles is time-sensitive. Each one shows the date and time (New York ET) that I publish them. By the time you read them, market conditions may be quite different than that which is described in my posts, and upon which my analyses are based at that time.
* My posts are also re-published by several other websites and I have no control as to when their editors do so, or for the accuracy in their editing and reproduction of my content.
* In answer to this often-asked question, please be advised that I do not post articles from other writers on my site.
* From time to time, I will add updated market information and charts to some of my articles, so it's worth checking back here occasionally for the latest analyses.

DISCLAIMER: All the information contained within my posts are my opinions only and none of it may be construed as financial or trading advice...please read my full Disclaimer at this link.

Dots

* If the dots don't connect, gather more dots until they do...or, just follow the $$$...

Loyalty

Loyalty

ECONOMIC EVENTS

 UPCOMING (MAJOR) U.S. ECONOMIC EVENTS...

***2024***
* Wed. March 6 @ 2:00 pm ET - Beige Book Report
* Fri. March 8 @ 8:30 am ET - Employment Data
* Wed. March 20 @ 2:00 pm ET - FOMC Rate Announcement + Forecasts and @ 2:30 pm ET - Fed Chair Press Conference
* Wed. April 10 @ 2:00 pm ET - FOMC Meeting Minutes

*** CLICK HERE for link to Economic Calendars for all upcoming events.

Thursday, November 03, 2011

Gold's Relationship to $SPX

With all the contradicting rumours recently regarding Europe, it may be worth watching the relationship of price action on Gold versus the S&P 500 Index ($SPX)...to see which one may be acting as actual bullish buying versus hedging on a potential bearish downturn.

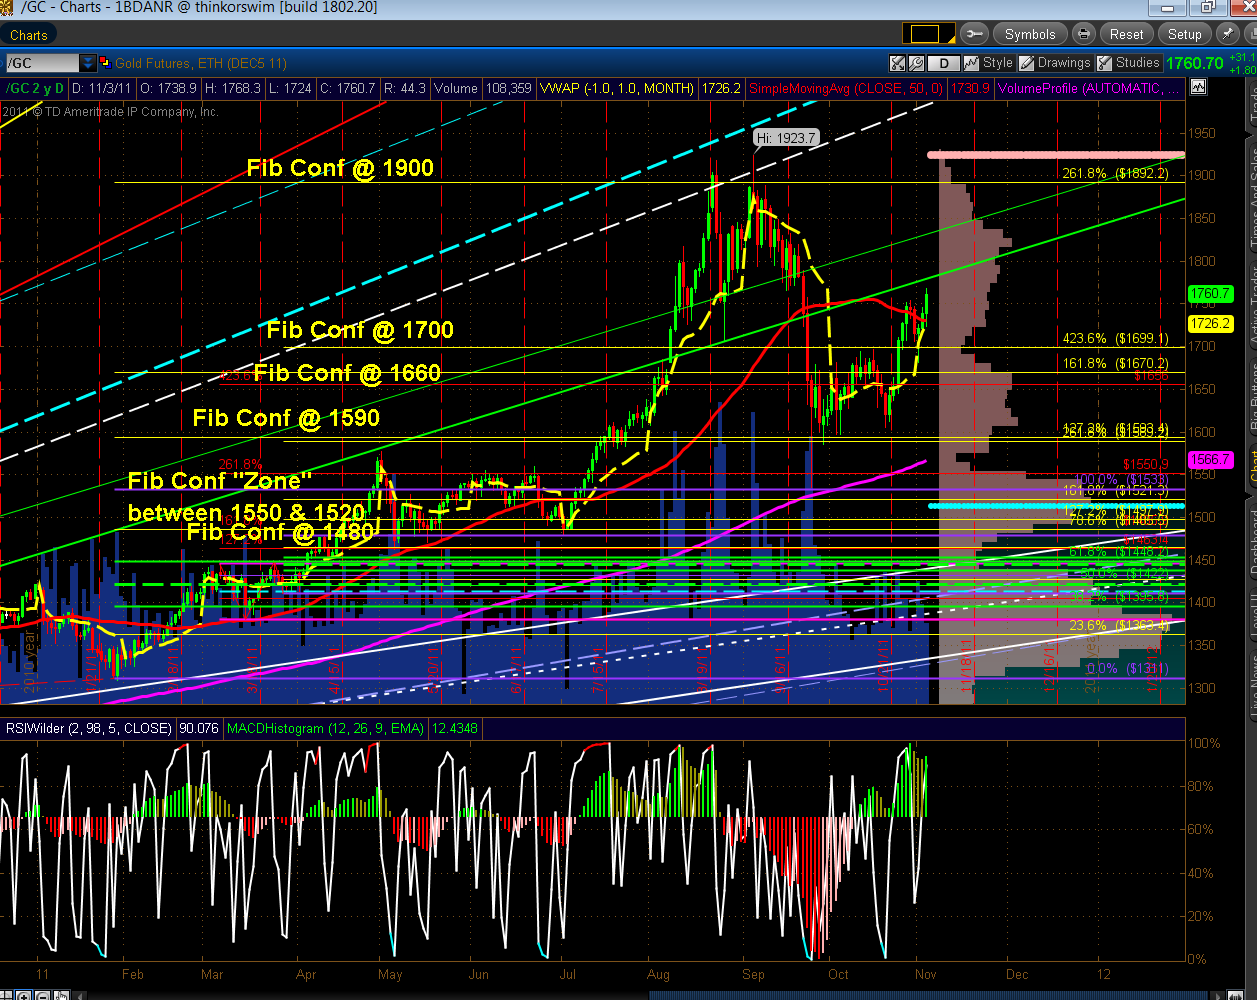
Below are Daily charts of Dec/11 Gold and $SPX.

Gold has been quietly rising after finding support around 1600 and has broken above its last swing high...above are a couple of Fibonacci fan line resistance levels around 1775 and 1830, so it has room for further upside movement.

$SPX has run into a confluence of price and Fibonacci fan line resistance and, as I mentioned in last night's post, may be forming the right shoulder of a H&S pattern.


Below is a 20-day 30-minute percentage comparison chart of Dec/11 Gold and $SPX. Up until today, the $SPX has led the advance in percentage terms...but Gold is not far behind as of today's writing...I'll be watching for any sign of a cross-over in the next few days as traders potentially lose confidence in equities.


With all the temper tantrums being thrown in Europe, fund managers may find that Gold is the safest place to park their money for the next while...another relationship that I'll be watching over the next days/weeks to come.